Figures & data
Figure 1 Humphrey visual field for patient 1 showing gray scale image and total and pattern deviation demonstrating dense right homonymous hemianopsia.
Abbreviations: MD, Mean deviation; PSD, Pattern standard deviation.
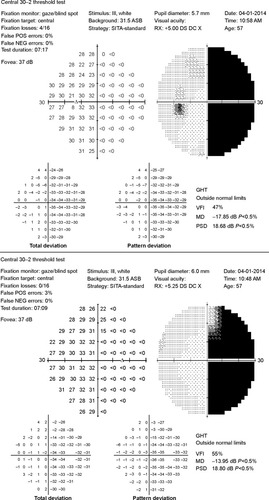
Figure 2 (A) SD-OCT RNFL for patient 1 showing normal thickness without a relative difference in thickness between affected and unaffected fibers as well as an example of how the calculations were performed. (B) SD-OCT ganglion cell complex for patient 1 showing relative thinning in the nasal macula of the right eye and temporal macula of the left eye corresponding to the right hemianopsia.
Abbreviations: RNFL, retinal nerve fiber layer; SD-OCT, spectral-domain optical coherence tomography; IPL, inner plexiform layer; GCL, ganglion cell layer; ONH, optic nerve head; OD, right eye; OS, left eye; OU, both eyes.
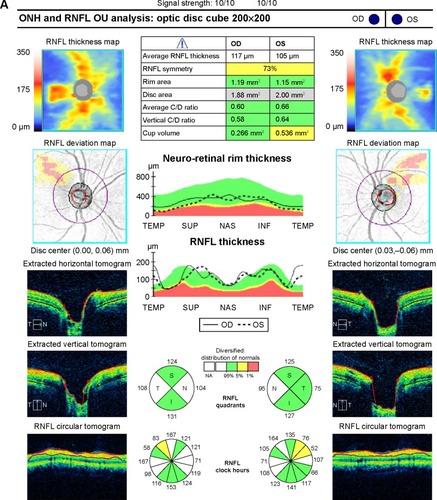
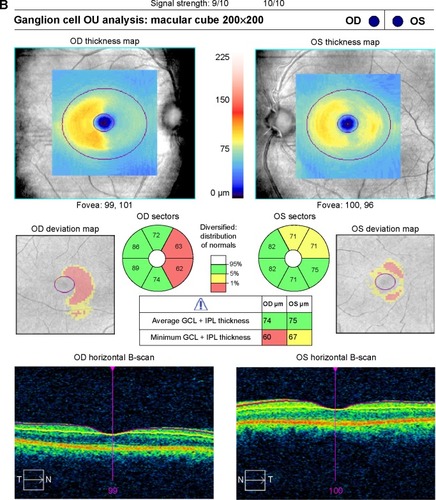
Table 1 Patient demographics and clinical data
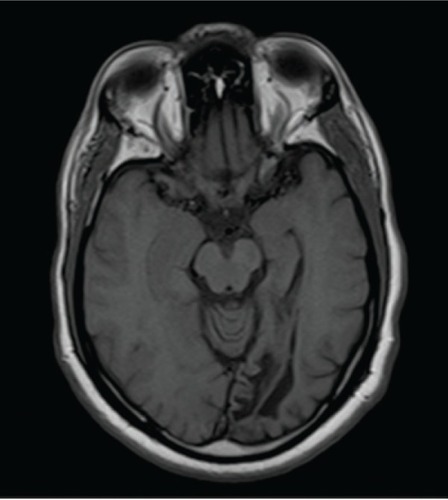
Figure 3 Axial T1-weighted magnetic resonance image of patient 1 demonstrating encephalomalacia of the left occipital lobe.