Figures & data
Figure 1 Box and whisker plot showing change in IOP at 1 hour after MDLT.
Abbreviations: IOP, intraocular pressure; MDLT, micropulse diode laser trabeculoplasty.
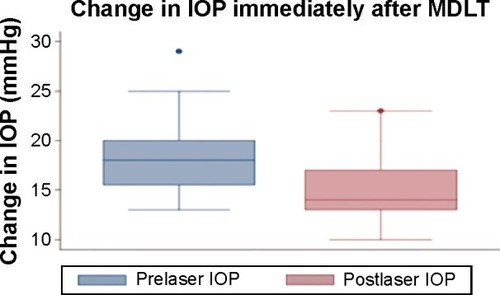
Figure 2 Histogram showing percentage change in IOP after MDLT.
Abbreviations: IOP, intraocular pressure; MDLT, micropulse diode laser trabeculoplasty.
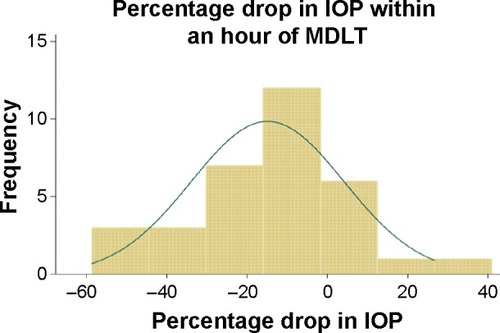
Figure 3 Change in IOP at the latest follow-up.
Abbreviations: IOP, intraocular pressure; MDLT, micropulse diode laser trabeculoplasty.
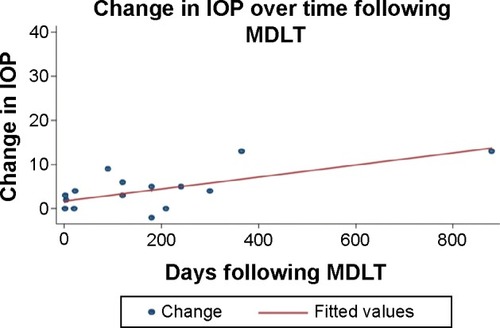
Figure 4 Distribution of IOP at various stages of follow-up within the study population.
Abbreviation: IOP, intraocular pressure.
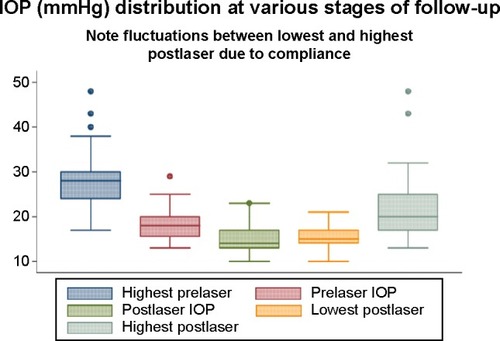
Figure 5 The effect of spot size on the change in IOP.
Note: ANOVA P=0.087.
Abbreviations: IOP, intraocular pressure; ANOVA, analysis of variance.
Abbreviations: IOP, intraocular pressure; ANOVA, analysis of variance.
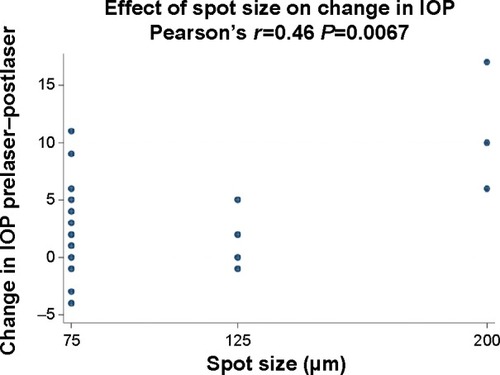
Figure 6 The effect of total laser power delivered on the change in IOP.
Note:
P=0.0011, R2=0.2943.
Abbreviation: IOP, intraocular pressure.
Abbreviation: IOP, intraocular pressure.
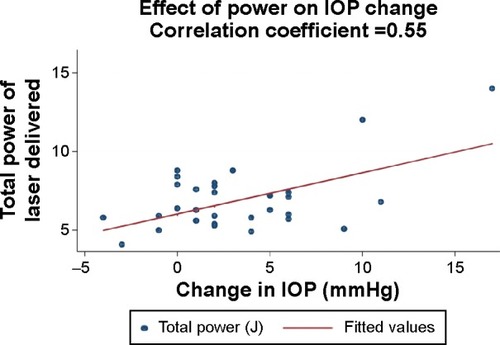
Figure 7 The effect of the total number of burns on the change in IOP.
Note:
P=0.7583, R2=0.0032.
Abbreviation: IOP, intraocular pressure.
Abbreviation: IOP, intraocular pressure.
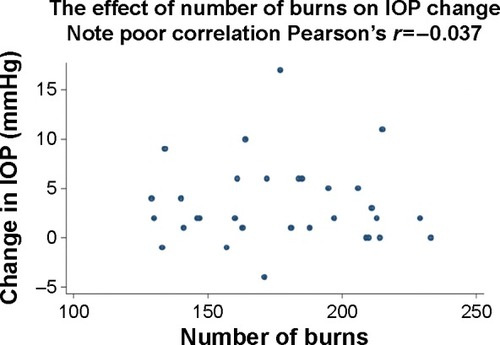
Figure 8 The effect of age on the response to laser treatment.
Note:
P=0.55, R2=0.00244.
Abbreviation: IOP, intraocular pressure.
Abbreviation: IOP, intraocular pressure.
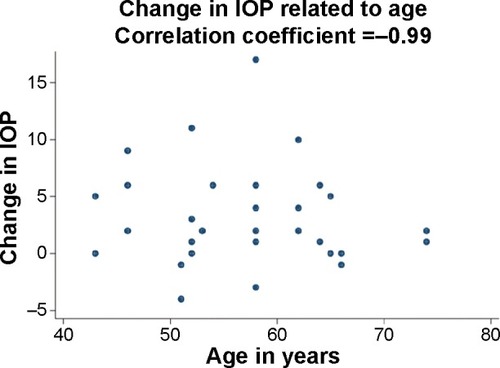
Figure 9 The FastPulse diode laser console-slit lamp setup.