
Figures & data
Figure 1 The eye drop chart.
Notes: At the front the various eye drops with their frequencies and visual explanations are given (A). At the back there are detailed instructions about the eye drop chart and how to use it as well as instructions about drop instillation (B) along with a detailed educational leaflet of correct eye drop administration technique (C).
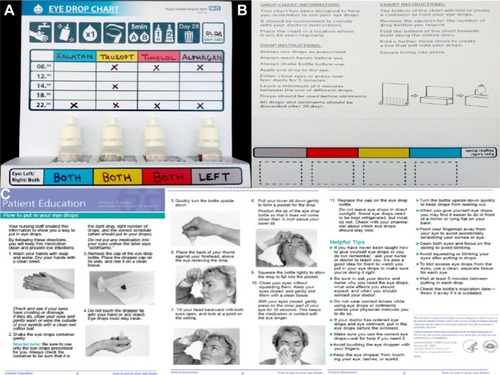
Table 1 Questionnaire regarding the use of EDC – pre- and posttest
Table 2 Reflective questions following the trial of EDC
Table 3 Demographics and clinical characteristics
Table 4 Comparison of pre- and post-EDC results of steps taken during administration process of eye drops