Figures & data
Table 1 Characteristics of the contact lenses used in the study
Figure 1 Measurement of conjunctival indentation.
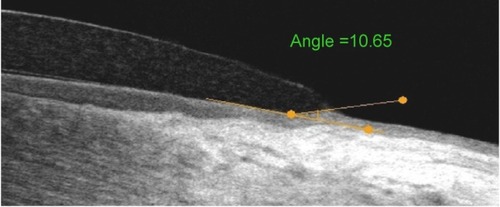
Figure 2 Visualization of limbal gaps located at the corneoscleral junction.
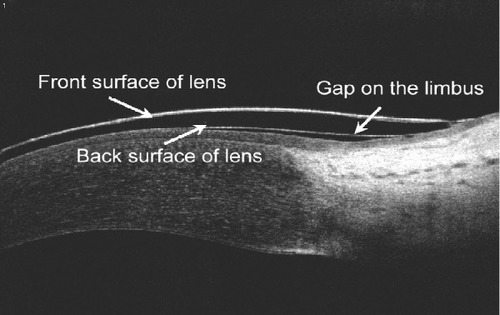
Figure 3 Angle of conjunctival indentation was measured by optical coherence tomography for different edge designs.
Notes: (A) Knife-edge design (Acuvue Oasys). (B) Round-edge design (PureVision 2 HD). (C) Semi-round edge design (PremiO). (D) Chisel-edge design (Air Optix Aqua).
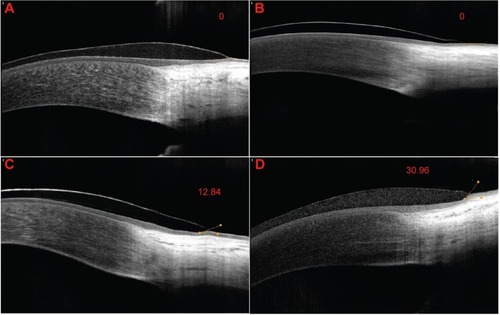
Figure 4 Comparison of conjunctival pressure exerted by the lens edge for different edge designs, regardless of the lens power.
Abbreviations: SD, standard deviation; SEM, standard error of the mean.
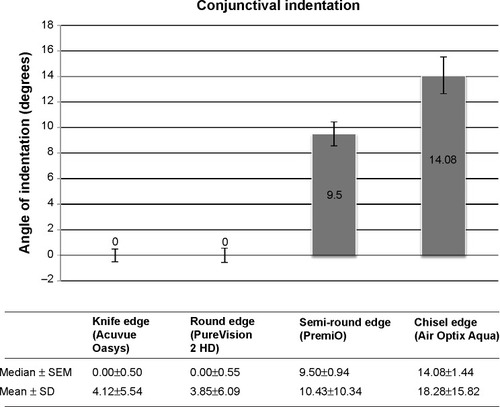
Figure 5 Distribution of conjunctival indentation according to lens power and edge design.
Abbreviation: D, diopters.
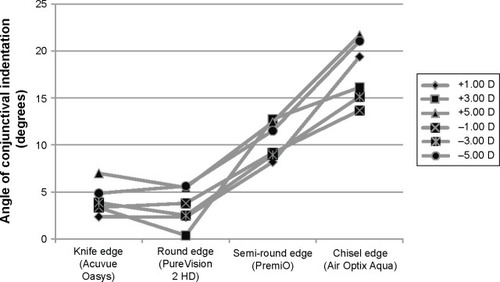
Figure 6 Occurrence of tear film gaps at the limbus according to lens edge designs.
Note: *Significantly different from knife edge (P=0.001) and semi-round edge (P=0.0004).
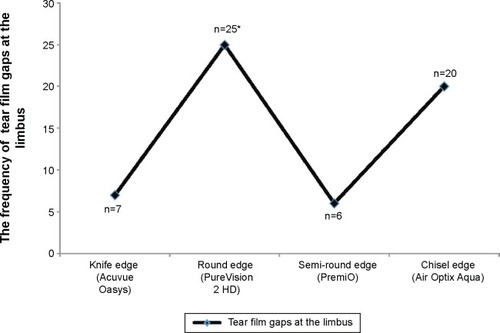
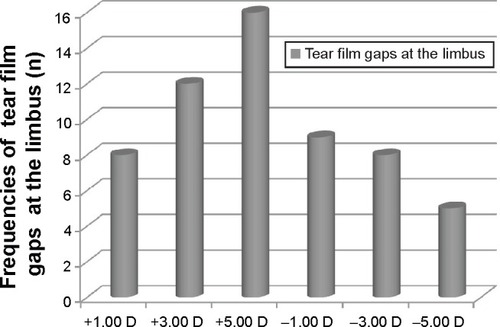
Figure 7 Distribution of limbal tear film gaps according to lens powers.
Note:
P=0.017.
Abbreviation: D, diopters.
Abbreviation: D, diopters.