
Figures & data
Figure 1 Patient disposition in the Phase III study comparing FCBT PF with FCBT.
Abbreviations: FCBT PF, preservative-free formulation of fixed-combination bimatoprost 0.03%/timolol 0.5%; FCBT, fixed-combination bimatoprost 0.03%/timolol 0.5%; ITT, intent-to-treat; PP, per protocol.
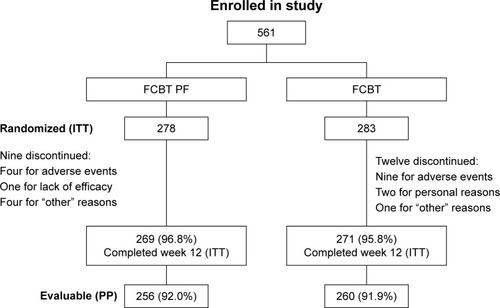
Figure 2 Changes in average eye IOP from baseline in treatment-naïve vs previously treated patients who received FCBT PF.
Note: *P≤0.05 vs previously treated.
Abbreviations: IOP, intraocular pressure; FCBT PF, preservative-free formulation of fixed-combination bimatoprost 0.03%/timolol 0.5%.
Abbreviations: IOP, intraocular pressure; FCBT PF, preservative-free formulation of fixed-combination bimatoprost 0.03%/timolol 0.5%.
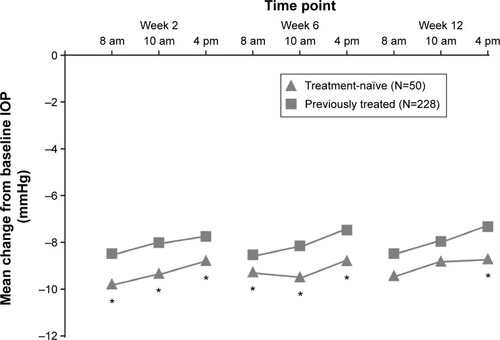
Figure 3 Changes in average eye IOP from baseline in treatment-naïve vs previously treated patients who received FCBT.
Abbreviations: IOP, intraocular pressure; FCBT, fixed-combination bimatoprost 0.03%/timolol 0.5%.
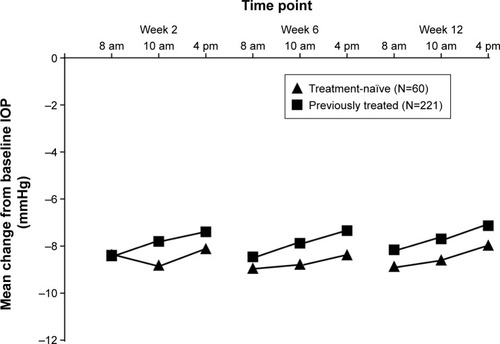
Table 1 Patients’ baseline characteristics that affect IOP lowering in the post hoc analysis
Table 2 Adverse events in treatment-naïve and previously treated patients