
Figures & data
Figure 1 Changes in mean postoperative IOP in all patients.
Abbreviations: IOP, intraocular pressure; TLE, trabeculectomy.

Figure 2 Changes in mean postoperative IOP for patients with primary open-angle glaucoma.
Abbreviations: IOP, intraocular pressure; TLE, trabeculectomy.
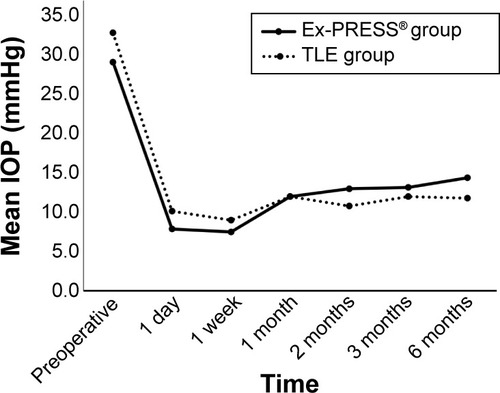
Figure 3 Changes in mean postoperative IOP for patients with neovascular glaucoma.
Abbreviations: IOP, intraocular pressure; TLE, trabeculectomy.
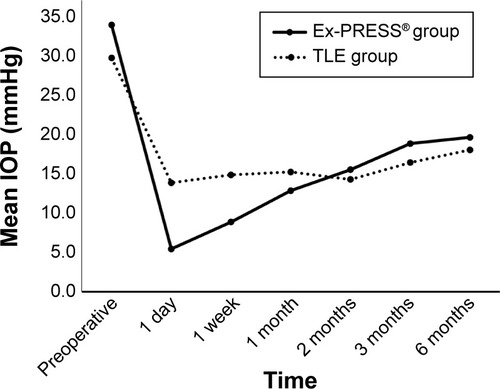
Table 1 Patient characteristics and study follow-up
Table 2 Type of glaucoma
Figure 4 Changes in mean postoperative IOP in patients with POAG or NVG in the Ex-PRESS® group.
Abbreviations: IOP, intraocular pressure; TLE, trabeculectomy; POAG, primary open-angle glaucoma; NVG, neovascular glaucoma.
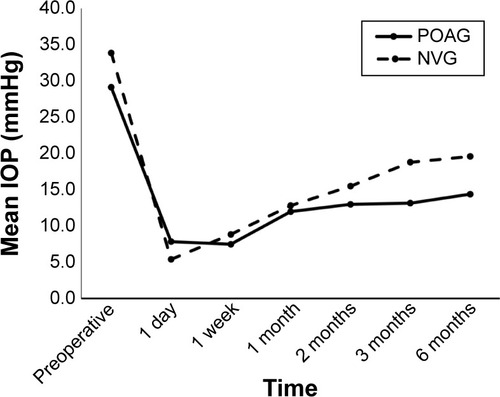
Figure 5 Complete success rate after surgery, as measured by the percentage of patients with a postoperative IOP less than 30% of the preoperative IOP.
Abbreviations: IOP, intraocular pressure; TLE, trabeculectomy.
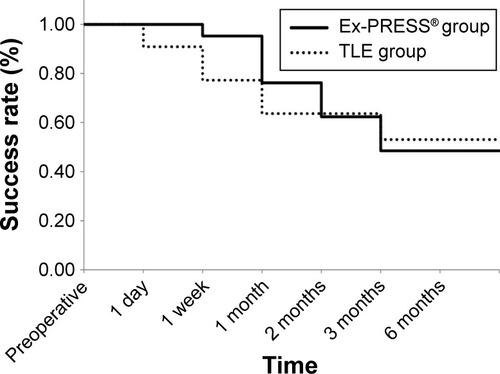
Figure 6 Qualified success rate after surgery, as measured by the percentage of patients with a postoperative IOP less than 30% of the preoperative IOP.
Abbreviations: IOP, intraocular pressure; TLE, trabeculectomy.
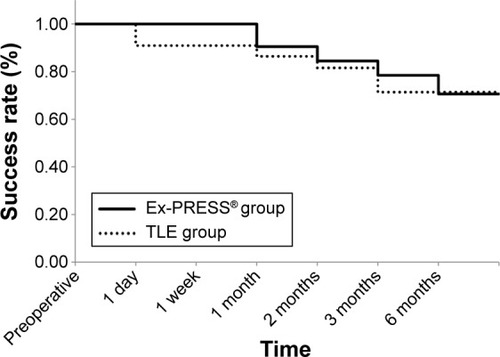
Figure 7 Complete success rate after surgery, as measured by the percentage of patients with a postoperative IOP between 5 and 21 mmHg.
Abbreviations: IOP, intraocular pressure; TLE, trabeculectomy.
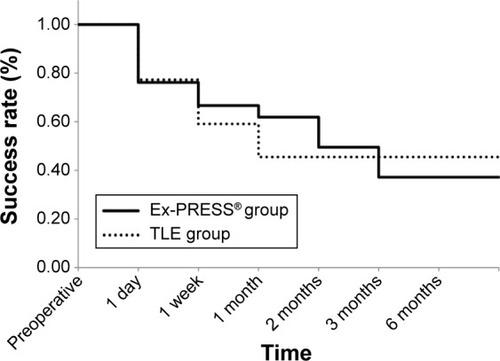
Figure 8 Qualified success rate after surgery, as measured by the percentage of patients with a postoperative IOP between 5 and 21 mmHg.
Abbreviations: IOP, intraocular pressure; TLE, trabeculectomy.
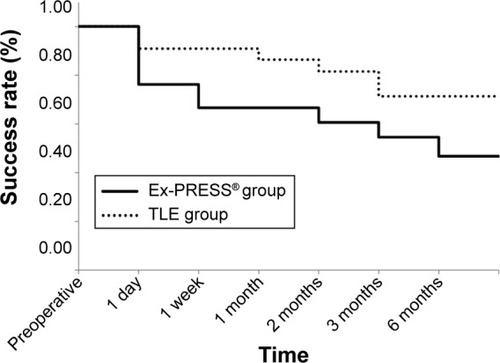
Table 3 Postoperative complications
Table 4 Postoperative treatment
Table 5 Height of the filtering bleb
Table 6 Comparison of postoperative complications and treatment for patients in the Ex-PRESS® group with primary open-angle glaucoma or neovascular glaucoma