Figures & data
Table 1 Demographic and relevant clinical characteristics of study participants
Table 2 10–2 VF outcomes
Figure 1 Four consecutive 10–2 visual fields with a red target in a patient taking hydroxychloroquine without retinopathy.
Note: Point scotomas are common (red- and green-circled scotoma points) and do not persist (note the last two visual fields).
Abbreviations: FL, fixation losses; FN, false negatives; FP, false positives.
Abbreviations: FL, fixation losses; FN, false negatives; FP, false positives.
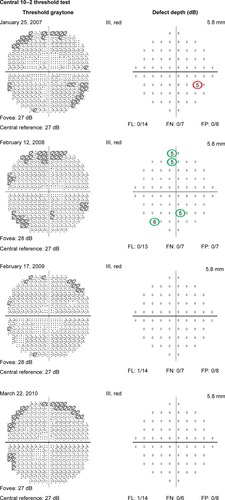
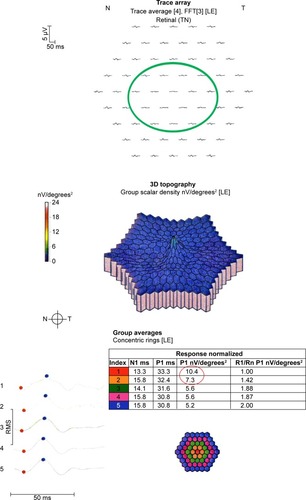
Figure 2 mfERG of a patient taking hydroxychloroquine without retinopathy.
Note: The mfERG is normal.
Abbreviations: FFT, fast fourier transform; LE, left eye; T, temporal; N, nasal; TN, temporal-nasal; N1, implicit time of the initial negative wave trough; P1, implicit time of the initial positive wave peak; R1, ring 1; Rn, ring n; RMS, root mean square.
Abbreviations: FFT, fast fourier transform; LE, left eye; T, temporal; N, nasal; TN, temporal-nasal; N1, implicit time of the initial negative wave trough; P1, implicit time of the initial positive wave peak; R1, ring 1; Rn, ring n; RMS, root mean square.
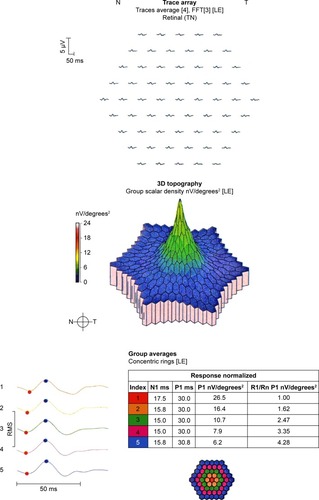
Figure 3 Three consecutive 10–2 visual fields with a red target in a patient taking hydroxychloroquine at toxic doses who developed retinopathy.
Notes: An incomplete annular scotoma in the zone from 2° to 8° from fixation is seen in the first visual field. This scotoma was reproducible (green-circled scotoma points) and enlarged (blue- and purple- circled scotoma points) from 2009 to 2011.
Abbreviations: FL, fixation losses; FN, false negatives; FP, false positives; FASTPAC, a bracketing strategy proprietary to the Humphrey visual field analyzer.
Abbreviations: FL, fixation losses; FN, false negatives; FP, false positives; FASTPAC, a bracketing strategy proprietary to the Humphrey visual field analyzer.
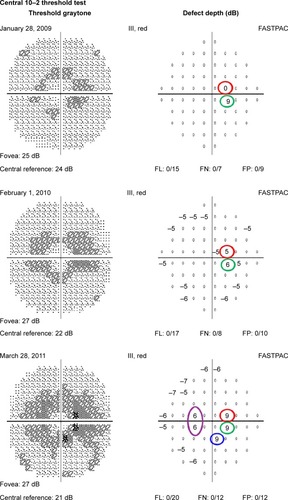
Figure 4 mfERG of a patient taking hydroxychloroquine at toxic doses who developed retinopathy.
Note: The mfERG shows reduced amplitudes in rings R1 and R2 (red-circled values) and flattened waveforms in the green-circled locations.
Abbreviations: FFT, fast fourier transform; LE, left eye; T, temporal; N, nasal; TN, temporal-nasal; N1, implicit time of the initial negative wave trough; P1, implicit time of the initial positive wave peak; R1, ring 1; Rn, ring n; RMS, root mean square.
Abbreviations: FFT, fast fourier transform; LE, left eye; T, temporal; N, nasal; TN, temporal-nasal; N1, implicit time of the initial negative wave trough; P1, implicit time of the initial positive wave peak; R1, ring 1; Rn, ring n; RMS, root mean square.