
Figures & data
Table 1 Age groups with MdVL, MVL, and SVL at presentation and at the end of the study
Table 2 Baseline characteristics of the uveitis patient at the time of diagnosis
Figure 1 Change in logMAR at last follow-up from logMAR at baseline (ie, at diagnosis) for the set of eyes that had both baseline and follow-up BCVA assessed (n=604 eyes).
Abbreviations: BCVA, best-corrected visual acuity; logMAR, logarithm of the minimum angle of resolution.
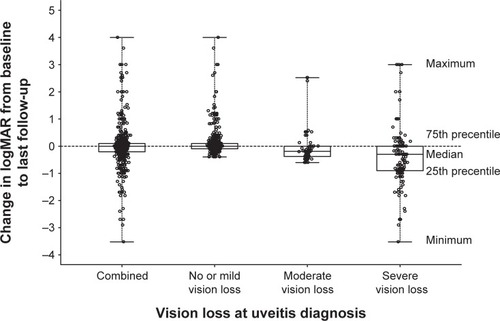
Table 3 Visual outcomes for the subset of uveitis patients with both baseline and follow-up visual acuity assessments (n=458; 604 eyes)
Figure 2 Quantile regression predictions for patient level median logMAR as a linear function of follow-up time (years).
Abbreviation: logMAR, logarithm of the minimum angle of resolution.
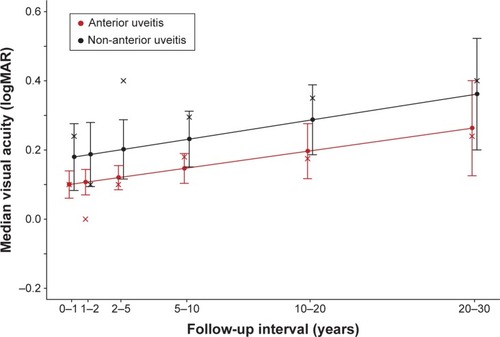
Table 4 Anatomical classification (n=491, 644 eyes)
Table 5 Diagnostic uveitis classification for MdVL, MVL, SVL for those eyes that had both initial and final BCVA available (n=458; 604 eyes)
Table 6 Ophthalmic management and interventions