Figures & data
Table 1 Corneal wavefront aberrations with a 4.0 mm aperture diameter over time. Corresponding two-tailed P-values for the comparison between the visits are shown for each parameter
Table 2 Change in visual and refractive data over time. Corresponding two-tailed P-values for the comparison between the visits are shown for each parameter
Figure 1 Trend of higher-order aberrations over time.
Notes: Corneal wavefront (WF) maps of higher-order aberrations (HOA) of one eye preoperatively (A) and 3 years after (B) limbal relaxing incisions (LRIs) and intraocular lens implantation. Correlated point spread function (PSF) maps obtained with optical path difference (OPD)-Scan II of one eye preoperatively (C) and 3 years after (D) surgery. In this patient wavefront error provided by HOA increased slightly over time determining an unchanged PSF.
Abbreviations: corn, cornea; HO, higher-order; WF, wavefront.
Abbreviations: corn, cornea; HO, higher-order; WF, wavefront.
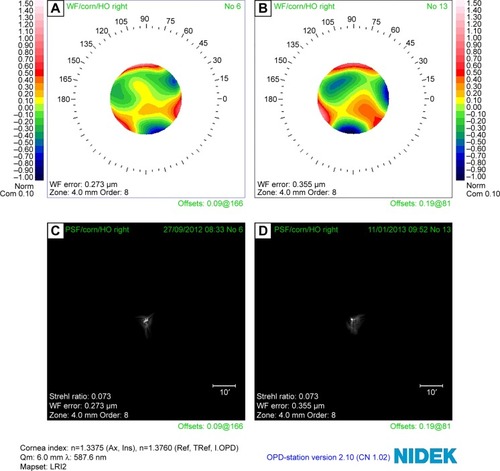
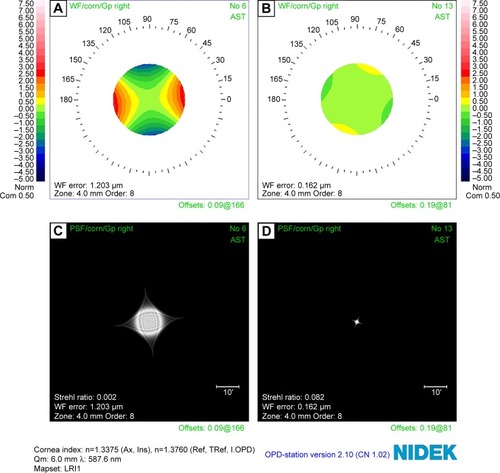
Figure 2 Trend of astigmatism aberration over time.
Notes: Corneal wavefront (WF) maps of astigmatism of one eye preoperatively (A) and 3 years after (B) limbal relaxing incisions (LRIs) and intraocular lens implantation. Correlated point spread function (PSF) maps obtained with optical path difference (OPD)-Scan II of one eye preoperatively (C) and 3 years after (D) surgery. The PSF displays the simulated view of how a point source of light like a star at infinity looks to a patient. The minor deformation of the light point source, the good Strehl ratio, and the relatively low level of wavefront error demonstrate the good quality of vision. In this patient wavefront error provided by astigmatism decreased over time determining a better PSF.
Abbreviations: corn, cornea; WF, wavefront.
Abbreviations: corn, cornea; WF, wavefront.