Figures & data
Table 1 The revised Newcastle Control Score
Table 2 Classification of the results of the stereotests into four categories
Table 3 Median and ranges for each stereotests for cases and controls
Table 4 Categorical agreement between the System Chart SC-1600 Pola and the Distance Randot Stereotest in patients with intermittent exotropia
Table 5 Categorical agreement between the System Chart SC-1600 Pola and the Distance Randot Stereotest in controls
Figure 1 Relationship between NCS and distance stereoacuity using the SC test.
Notes: Stereoacuity scores were correlated (A) with the distance NCS (rs=0.48, P=0.01) and (B) total NCS (rs=0.60, P=0.0008).
Abbreviations: NCS, Newcastle Control Score; SC, System Chart SC-1600 Pola.
Abbreviations: NCS, Newcastle Control Score; SC, System Chart SC-1600 Pola.
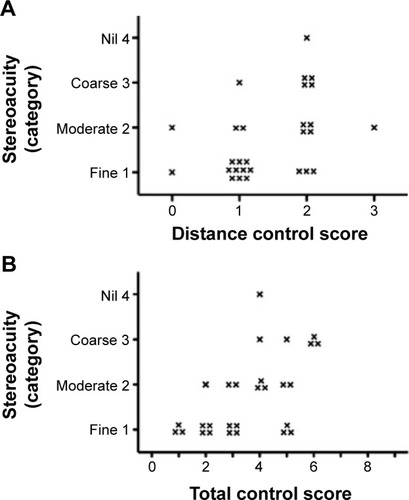
Figure 2 Relationship between NCS and distance stereoacuity using the DR test.
Notes: No significant correlation was found between DR test scores and the (A) distance NCS (rs=0.03, P=0.90) and (B) total NCS (rs=−0.07, P=0.73).
Abbreviations: DR, Distance Randot Stereotest; NCS, Newcastle Control Score.
Abbreviations: DR, Distance Randot Stereotest; NCS, Newcastle Control Score.
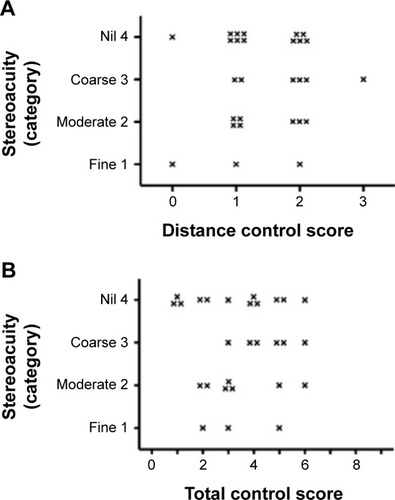
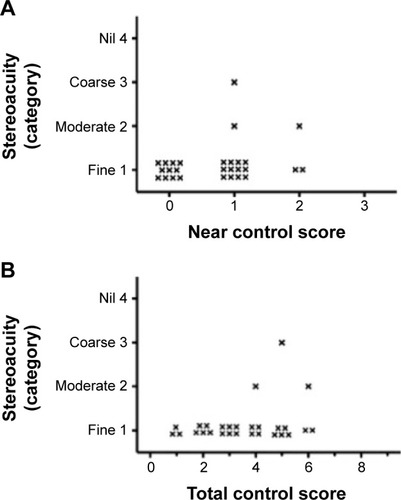
Figure 3 Relationship between NCS and near stereoacuity using the TST.
Notes: No significant correlation was found between TST scores and the (A) near NCS (rs=0.32, P=0.10) and (B) total NCS (rs=0.33, P=0.08).
Abbreviations: NCS, Newcastle Control Score; TST, Titmus stereotest.
Abbreviations: NCS, Newcastle Control Score; TST, Titmus stereotest.