
Figures & data
Table 1 Patient demographics and characteristics
Table 2 Ophthalmic treatment and interventions
Figure 1 Initial to final change in visual acuity (logMAR) for traumatic and nontraumatic uveitis patients.
Note: Each circle indicates one eye.
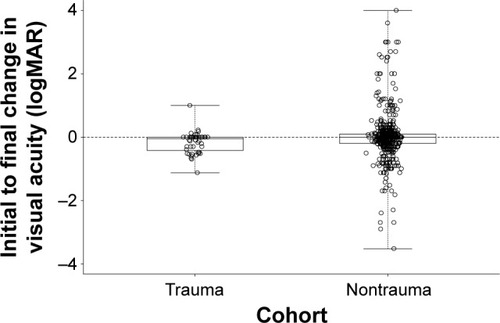
Table 3 Summary statistics for initial and final logMAR and initial to final change in logMAR for patients with both initial and final logMAR measurements
Figure 2 Initial to final change in IOP (mmHg) for traumatic and nontraumatic uveitis patients.
Abbreviation: IOP, intraocular pressure.
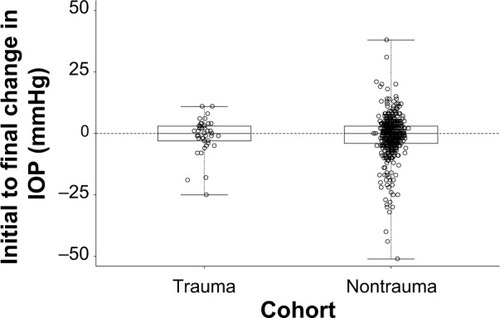
Table 4 Summary statistics for initial and final logMAR and initial to final change in logMAR for patients with both initial and final logMAR measurements
Table 5 Clinical outcomes of patients prescribed steroids and those not prescribed steroids