
Figures & data
Table 1 Demographic characteristics of the included patients and PCA at treatment
Figure 1 Image before IVR monotherapy (A); 6 days after IVR monotherapy (B); and after 6 months of IVR monotherapy (C).
Abbreviation: IVR, intravitreal ranibizumab.
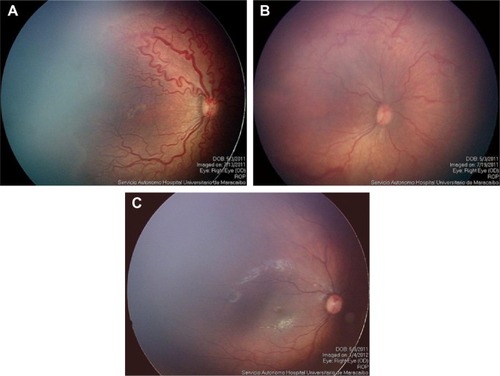
Table 2 Results of treatment according to groups