Figures & data
Figure 1 Patient receiving microcurrent treatment.
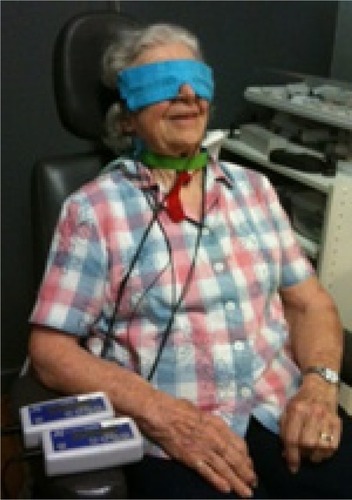
Figure 2 Dry AMD eyes: absolute logMAR differences from starting values for each patient, plotted over first 3 months only.
Abbreviations: AMD, age-related macular degeneration; logMAR, log of the minimum angle of resolution.
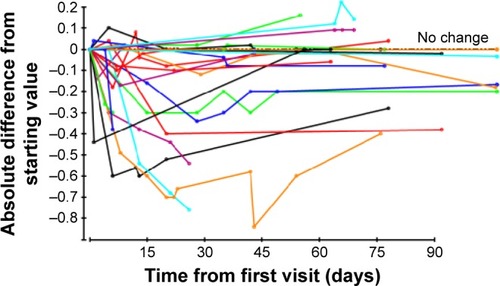
Figure 3 Wet AMD eyes: absolute logMAR differences from starting values for each patient, plotted over first 3 months only.
Abbreviations: AMD, age-related macular degeneration; logMAR, log of the minimum angle of resolution.
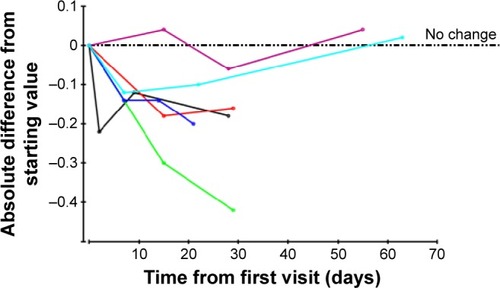
Figure 4 Dry AMD eyes: mean absolute logMAR differences from starting values with 95% confidence intervals on these means.
Abbreviations: AMD, age-related macular degeneration; logMAR, log of the minimum angle of resolution.
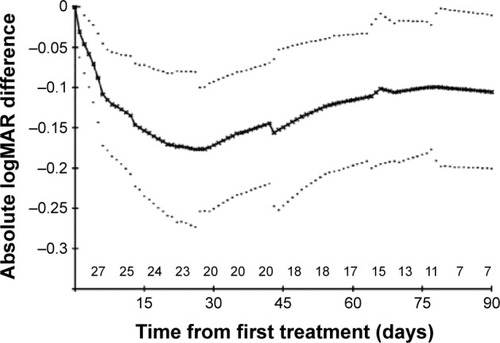
Figure 5 Wet AMD eyes: mean absolute logMAR differences from starting values with 95% confidence intervals on these means.
Abbreviations: AMD, age-related macular degeneration; logMAR, log of the minimum angle of resolution.
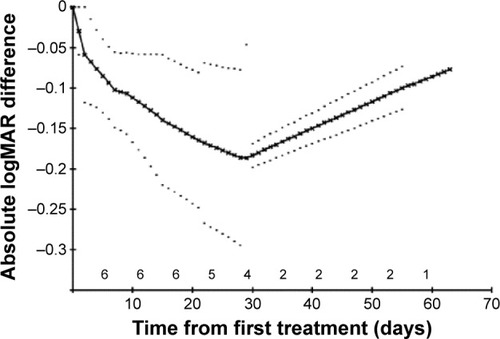
Table 1 VA results for dry AMD
Table 2 VA results for wet AMD
Figure 6 Dry AMD eyes: total letter change.
Abbreviation: AMD, age-related macular degeneration.
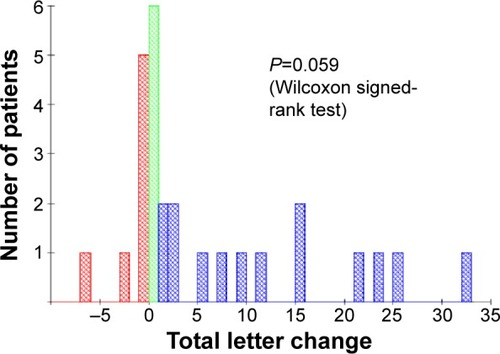
Figure 7 Wet AMD eyes: total letter change.
Abbreviation: AMD, age-related macular degeneration.
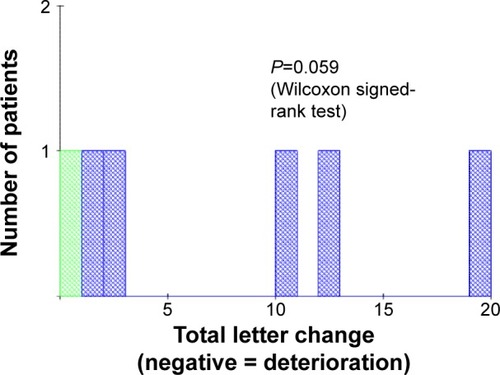
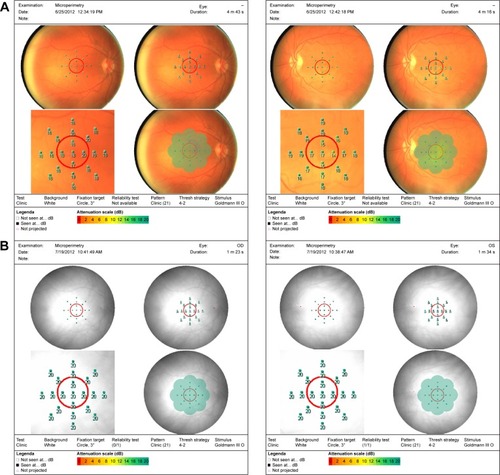
Figure 8 Pre- and post-microperimetry fields on three patients.
Abbreviation: MP-1, microperimeter-1.
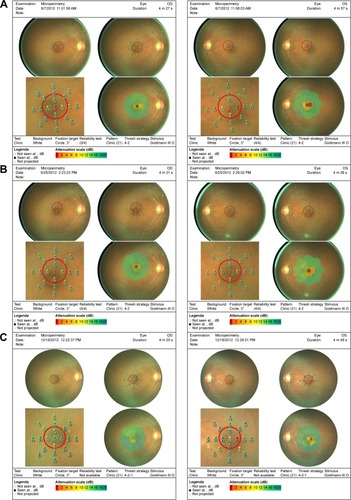
Figure 9 Pre- and post-microperimtery fields on two patients.
Abbreviation: MP-1, microperimeter-1.