
Figures & data
Figure 1 Age distribution in patients who had cataract surgery (group B) and who did not have surgery (group C).
Notes: For group B: 672 (32%) were ≤69 years; 803 (38%) 70–79 years; 586 (27%) 80–89 years, 71 (3%) ≥90 years. For group C: 115 (20%) were ≤69 years, 225 (40%) 70–79 years, 203 (36%) 80–89 years and 18 (3%) ≥90 years old. There was a statistically significant difference between group B and C in those who were 68 years and below and 80–89 years old (P<0.05).
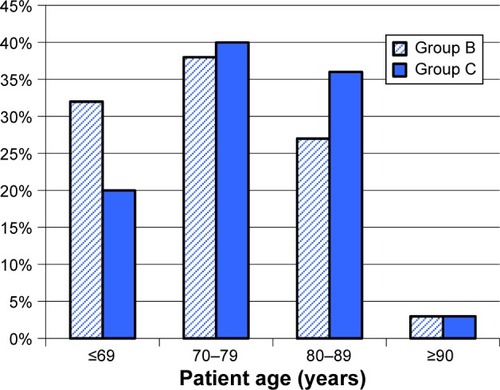
Figure 2 Best corrected visual acuity (BCVA) distribution at listing.
Notes: There was a statistically significant difference (P<0.05) in all groups between the operated eye (group B): 556 (26%) 6/12 or better; 1,275 (60%) 6/18–6/60; 266 (12%) counting fingers or worse, and eyes of patients who did not have surgery (group C): 664 (59%) 6/12 or better; 367 (33%) 6/18–6/60; 64 (6%) counting fingers or worse.
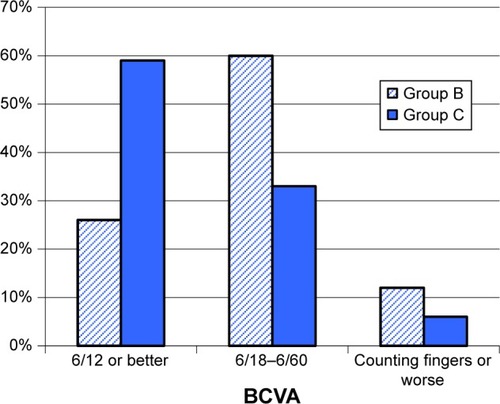
Figure 3 Presenting complaints.
Notes: The presenting complaint for the group that had cataract surgery (group B): 1,176 (56%) difficulty reading; 605 (28%) problems driving; 40 (2%) no significant problems; 17 (1%) other problems and for those who did not have surgery (group C): 242 (43%) difficulty reading; 81 (14%) problems driving; 85 (15%) no significant problems; 15 (3%) other problems (P<0.05). It should be noted that patients may have had more than one presenting complaint.
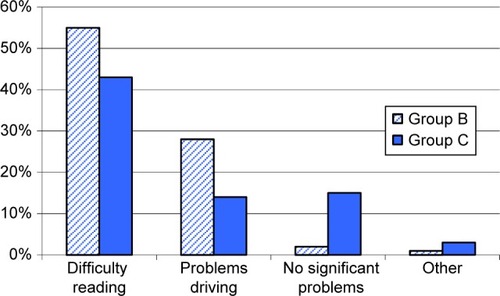
Figure 4 Past medical history.
Notes: Past medical history in group B versus group C for dementia/cognitive impairment (CI): 55 (2.6%) vs 29 (5.2%), P<0.05; cardiovascular accident (CVA): 158 (7.4%) vs 60 (10.7%), P<0.05; diabetes mellitus (DM): 372 (17.4%) vs 96 (17.1%), P=0.87; COPD/asthma: 382 (17.9%) vs 93 (16.6%), P=0,53; ischemic heart disease (IHD) or myocardial infarction (MI): 535 (25.1%) vs 155 (27.6%), P=0.35; hypertension (HTN): 971 (45.5%) vs 263 (46.9%), P=0.73. There is a statistically significant difference between group B and C for dementia/CI and CVA only. It should be noted that patients may have had more than one medical condition.
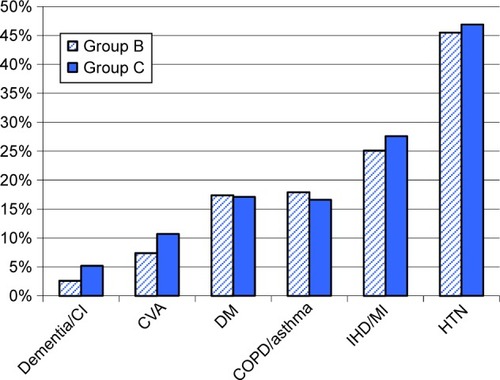
Table 1 Ocular history in patients who had cataract surgery (group B) and who did not have surgery (group C)
Table 2 Ocular co-pathology and reasons for a guarded visual prognosis for group B