Figures & data
Figure 1 Scheme to explain our hypothesis.
Note: Uncontrolled eye elongation can lead to a misalignment in the position of the fovea and the visual axis (white double arrowheads) and thinning of the macula (white square).
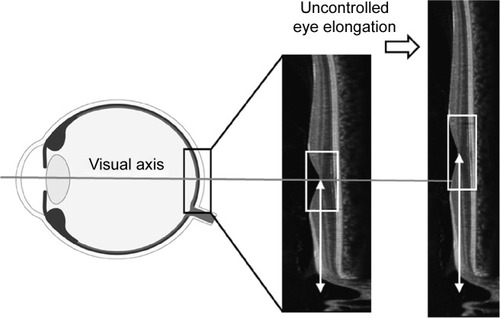
Figure 2 Measurement of ODF angle.
Note:
.
Abbreviation: ODF, optic disc-to-fovea.
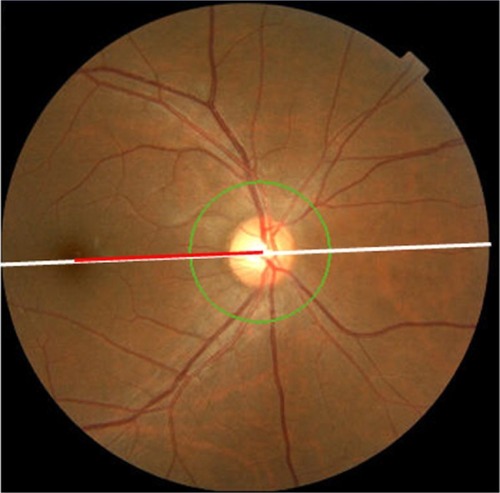
Figure 3 Pearson’s correlation coefficient between 64 areas retinal thickness and AL.
Notes: The correlation coefficient of the central four areas around the fovea was −0.07–0.01 and was not significant (red square). Reproduced with permission from the Association for Research in Vision and Ophthalmology, from Yamashita T, Tanaka M, Kii Y, Nakao K, Sakamoto T. Association between retinal thickness of 64 sectors in posterior pole determined by optical coherence tomography and axial length and body height. Invest Ophthalmol Vis Sci. 2013;54(12):7478–7482. Copyright © 2013; permission conveyed through Copyright Clearance Center, Inc.Citation5
Abbreviation: AL, axial length.
Abbreviation: AL, axial length.
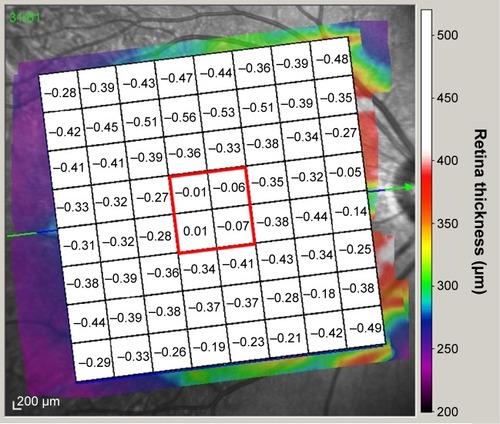
Figure 4 Scatterplot of the ODF angle against the AL.
Abbreviations: ODF, optic disc-to-fovea; AL, axial length.
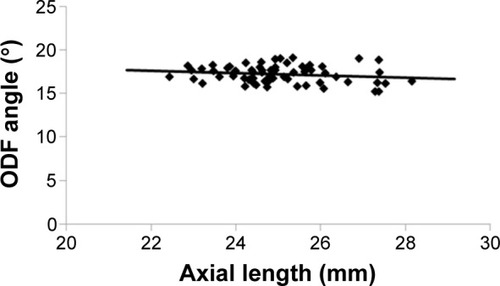
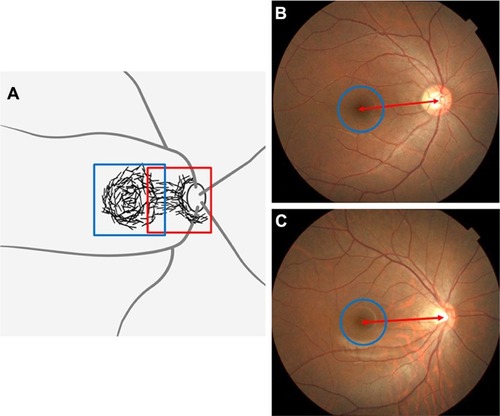
Figure 5 Schematic drawing of the distribution of NVSMCs (black lines).
Notes: (A) A plaque-like arrangement of NVSMC is present in the foveal region of the temporal quadrant (blue square), spreading up to the temporal rim of the optic nerve (red square). (B, C) The ODF angle (red double-headed arrows) and the central retinal thickness (blue circles) are constant regardless of the AL (B: 24.38 mm, C: 25.21 mm). Adapted from May CA. Non-vascular smooth muscle cells in the human choroid: distribution, development and further characterization. J Anat. 2005;207(4):381–390; with permission from John Wiley and Sons.Citation17
Abbreviations: NVSMCs, nonvascular smooth muscle α-actin positive cells; AL, axial length; ODF, optic disc-to-fovea.
Abbreviations: NVSMCs, nonvascular smooth muscle α-actin positive cells; AL, axial length; ODF, optic disc-to-fovea.