
Figures & data
Figure 1 Normogram of the disc damage likelihood scale.
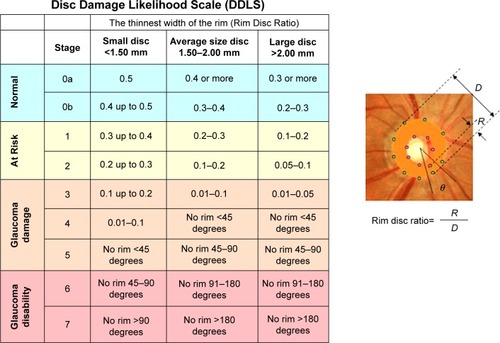
Table 1 Different glaucoma parameters in POAG and PEX glaucoma
Table 2 Correlation of the KOWA rim/disc ratio compared to RNFL, MRA, and GPS in the six quadrants of the optic nerve head in preperimetric POAG and PEX glaucoma
Figure 2 Agreement of the disc damage likelihood scale compared to the Moorfields regression analysis, the glaucoma probability score of the HRT3, and RNFL of the SD-OCT related to Diagnosis 1 and Diagnosis 2 in primary open angle glaucoma.
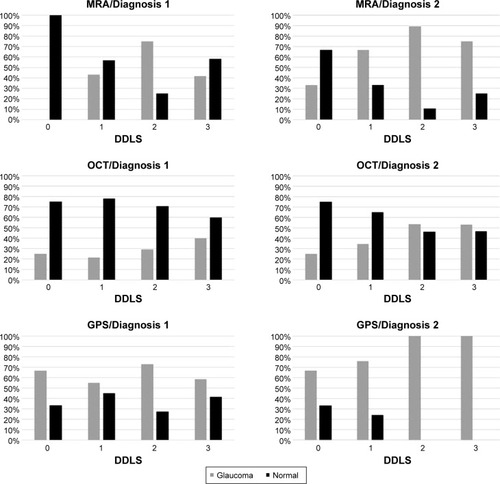
Figure 3 Agreement of the disc damage likelihood scale compared to the Moorfields regression analysis, the glaucoma probability score of the HRT3 and RNFL of the SD-OCT related to Diagnosis 1 and Diagnosis 2 in PEX glaucoma.
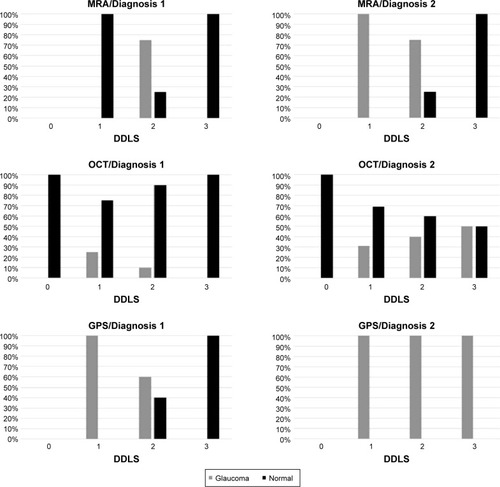
Figure 4 ROC curves of the discriminant formulas.
Abbreviations: DDLS, disc damage likelihood scale; FSM, Mikelberg coeffiecient; OCT, optic coherence tomography; RB, Burk coefficient; ROC, receiving operator curve.
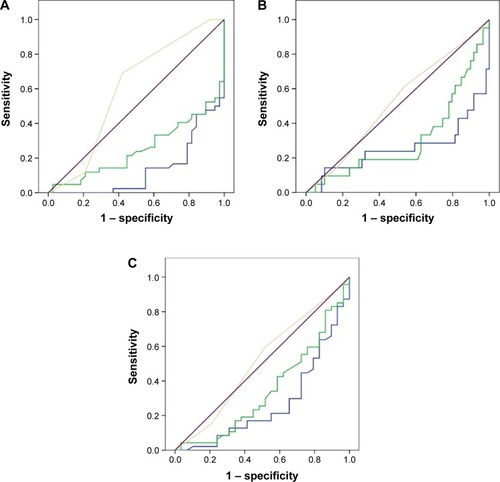
Figure 5 ROC curves of the discriminant formulas.
Abbreviations: DDLS, disc damage likelihood scale; FSM, Mikelberg coeffiecient; OCT, optic coherence tomography; RB, Burk coefficient; ROC, receiving operator curve.
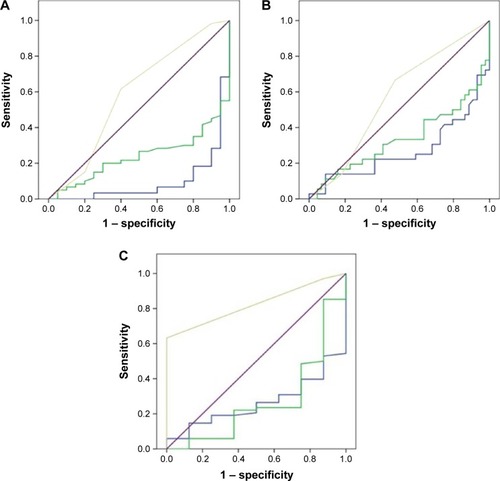
Table 3 Value of area under the ROC curve, sensitivity, specifically for FSM, RB, DDLS considering Diagnosis 1 and 2 (MRA, GPS, OCT)