
Figures & data
Figure 1 The areas to measure the macular sensitivity: center (foveal threshold), four points (blue line), 16 points (red line), and 36 points (green line) from fixation point.
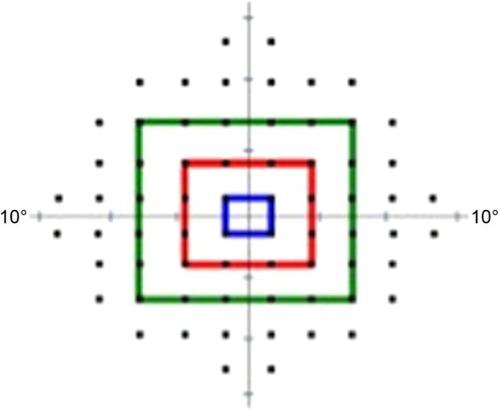
Figure 2 The areas to measure the macular sensitivity: superotemporal, superonasal, inferotemporal, and inferotemporal from fixation point.
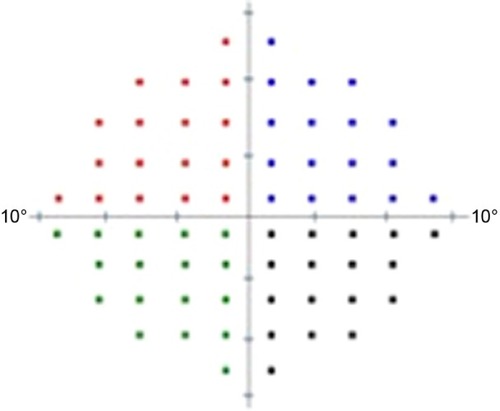
Table 1 Demographic and clinical characteristics of the patients (n=24)
Table 2 The comparative mean macular sensitivities in study and control eyes: four lines; foveal threshold, four, 16, and 36 points from fixation and four areas; superotemporal, superonasal, inferotemporal, and inferonasal areas