Figures & data
Figure 1 The ETDRS plot of macular topography containing variables and statistics for nine sections represented in the alphanumeric form in which the alphabets C, I, and O, respectively, define the central macula, inner macula, and outer macula, and each number uniquely defines one of the remaining eight sections.
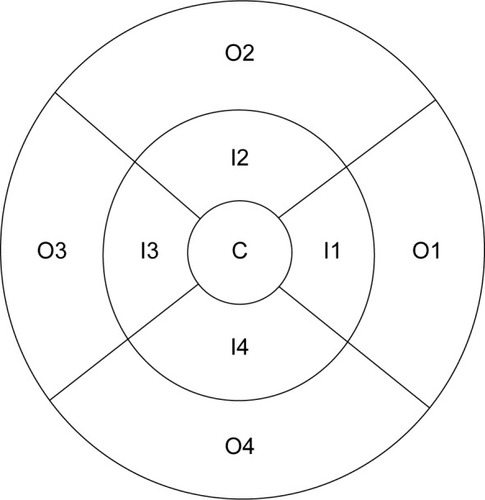
Table 1 Age distribution of participants
Table 2 Macular thickness measurements (μm) (right eyes, n=63)
Table 3 Macular thickness measurements (mm) (left eyes, n=63)
Table 4 Statistics of the macular measurements, for right eyes of all subjects, with subdivision into males and females
Table 5 Statistics of the macular measurements, for left eyes of all subjects, with subdivision into males and females
Table 6 Macular volume measurements (mm3) (right eyes, n=63)
Table 7 Statistics of the macular volume measurements, for right eyes of all subjects, with subdivision into males and females
Figure 2 The box-and-whisker’s plots showing distribution of average macular thickness by the axial length group.
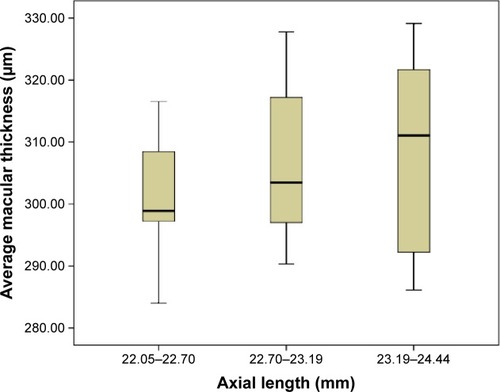
Figure 3 Scatterplot of average macular thickness versus age.
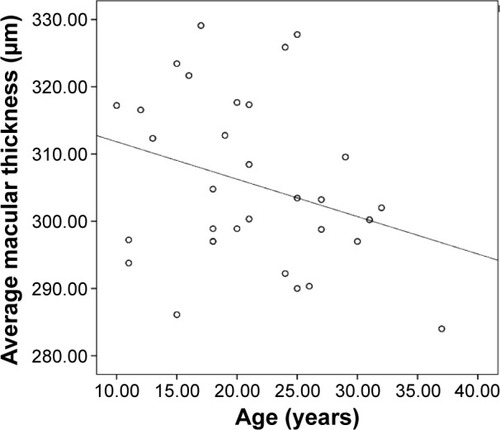
Figure 4 Scatterplot of total macular volume versus age.
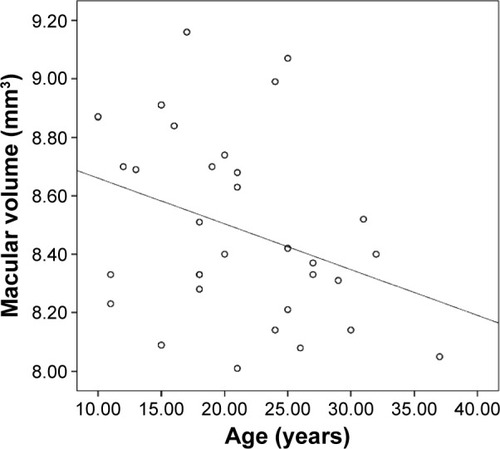
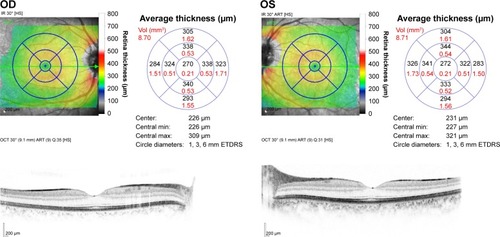
Figure 5 The optical coherence tomography report of the maculae of right and left eyes.