
Figures & data
Table 1 Composition of Brudypio® 1.5 g
Table 2 Description of variables at baseline (visit 0) and at 12 weeks in 1,255 patients with glaucoma with dry eye symptoms
Figure 1 Changes in Schirmer test scores in the right and left eyes at baseline (visit 0) and at visit at 12 weeks (*P<0.001, Wilcoxon rank sum test).
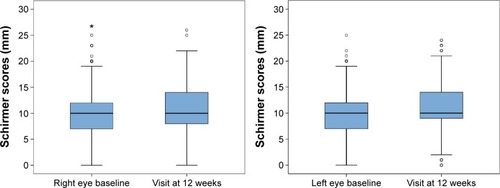
Figure 2 Changes in tear instability, TBUT, in the right and left eyes at baseline (visit 0) and at visit at 12 weeks (*P<0.001, Wilcoxon test).
Abbreviation: TBUT, tear breakup time.
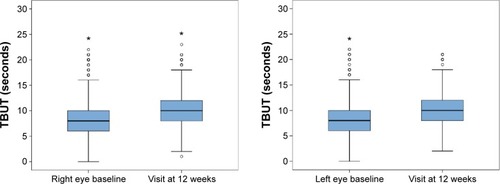
Table 3 Improvement of dry eye symptoms according to compliance with treatment
Table 4 Improvement of dry eye symptoms according to the degree of conjunctival hyperemia in the subgroup of compliant patientsTable Footnotea