Figures & data
Table 1 Prevalence of different CNV sub-types at baseline
Figure 1 Influence of baseline VA on visual outcomes.
Notes: Mean change in VA from baseline over a 36-month period, stratified by baseline VA. Linear regression analysis was used to determine the relationship between visual outcomes and baseline VA. P-values at each 12-monthly time interval: 0.092 (12 months), <0.001 (24 months), and <0.001 (36 months). A correlation coefficient (R) of 0.414 at 3 years suggests a positive correlation.
Abbreviations: VA, visual acuity; ETDRS, Early Treatment Diabetic Retinopathy Study.
Abbreviations: VA, visual acuity; ETDRS, Early Treatment Diabetic Retinopathy Study.
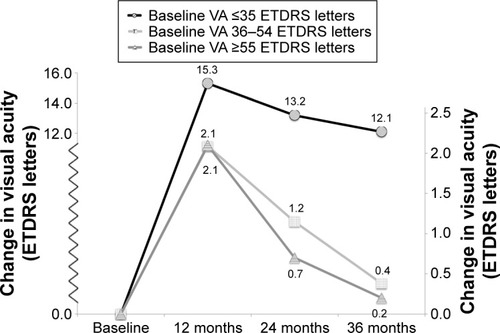
Table 2 Visual outcomes at 36 months, stratified by baseline VA
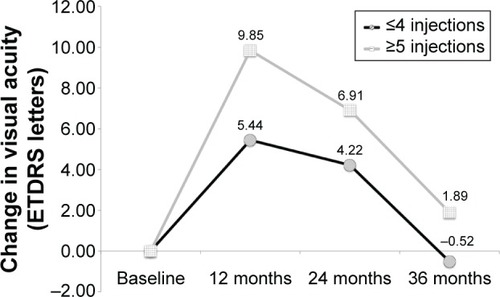
Figure 2 Influence of injection frequency on visual outcomes.
Notes: Mean change in VA from baseline over a 36-month period, stratified by injection frequency. Linear regression analysis was used to determine the relationship between visual outcomes and injection frequency. P-values at each 12-monthly time interval: 0.011 (12 months), 0.007 (24 months), and 0.036 (36 months). A correlation coefficient (R) of 0.244 at 3 years suggests a positive correlation.
Abbreviations: VA, visual acuity; ETDRS, Early Treatment Diabetic Retinopathy Study.
Abbreviations: VA, visual acuity; ETDRS, Early Treatment Diabetic Retinopathy Study.