Figures & data
Table 1 Central and peripheral refraction in all study visits and in each study group
Figure 1 Peripheral refraction (A) and relative peripheral refraction (B) for the children in the “nonmyopia, myopia” classification at baseline (left), at 12 months (middle), and at 18 months (right).
Notes: Plotted after univariate analysis of variance. (A) Central and peripheral refraction: statistically significant differences were found between groups (F2=73.21; P<0.01). However, there were nonsignificant differences between visits (F2=0.08; P=0.92) and visual field angle (F6=0.47; P=0.83) in refraction. (B) RPR: statistically significant differences were found between groups (F2=13.61; P<0.01), visits (F2=3.92; P=0.02), and visual field angle (F6=2.86; P=0.01). However, the interaction between visits and RPR was statistically nonsignificant between groups (F36=0.79; P=0.80).
Abbreviations: RPR, relative peripheral refraction; nMi-nMf, non-myopic after 18 months; nMi-Mf, non-myopic at baseline and developed myopia after 18 months; Mi-Mf, myopic during the 18 months.
Abbreviations: RPR, relative peripheral refraction; nMi-nMf, non-myopic after 18 months; nMi-Mf, non-myopic at baseline and developed myopia after 18 months; Mi-Mf, myopic during the 18 months.
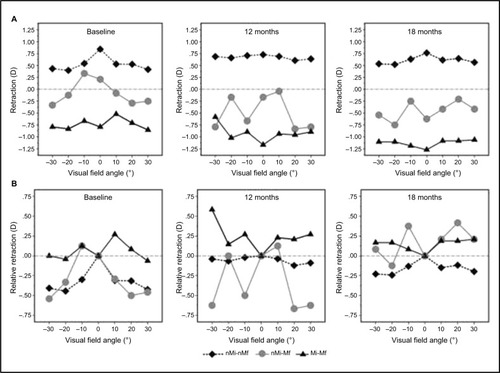
Table 2 Relative peripheral refraction in all study visits and in each study group
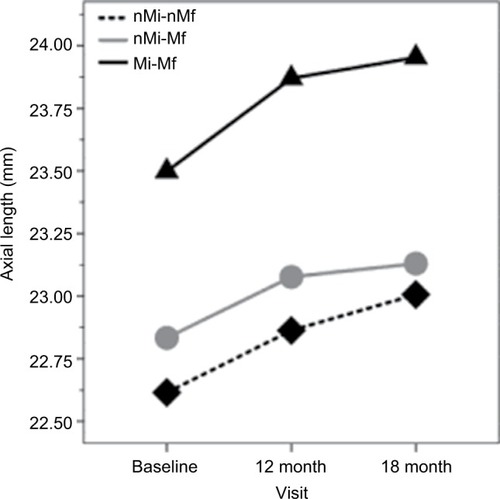
Figure 2 Axial length in all study visits and in each study group.
Abbreviations: nMi-nMf, non-myopic after 18 months; nMi-Mf, non-myopic at baseline and developed myopia after 18 months; Mi-Mf, myopic during the 18 months.