Figures & data
Table 1 Prevalence of clinically significant astigmatism sorted according to age (youngest to oldest) and axis distribution (with-the-rule, oblique and against-the-rule)
Table 2 Demographic information by gender and optical correction type
Figure 1 Age comparison for Group 2 (spectacle) and 3 (contact lens) wearers.
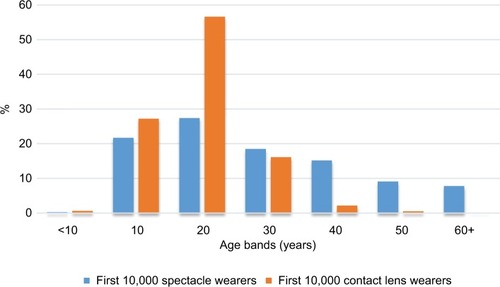
Figure 2 Type of astigmatism in spectacle wearers for right and left eyes (Group 2).
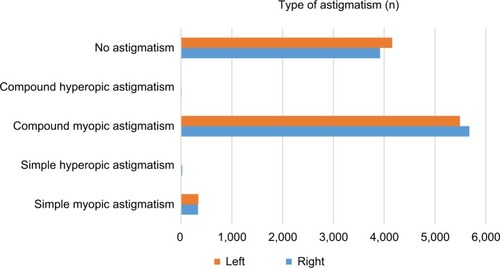
Figure 3 Comparison of cylindrical powers prescribed for Group 2 (spectacle wearers) and Group 3 (contact lens wearers).
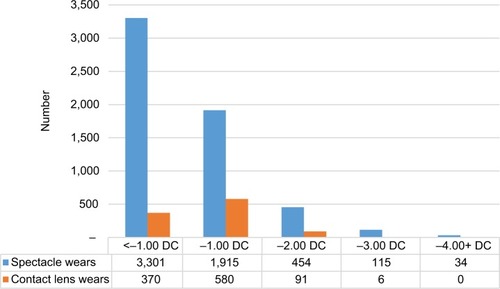
Figure 4 Number of right cylindrical lenses prescribed according to type by axis for CL wearers (Group 3) and spectacle wearers (Group 2).
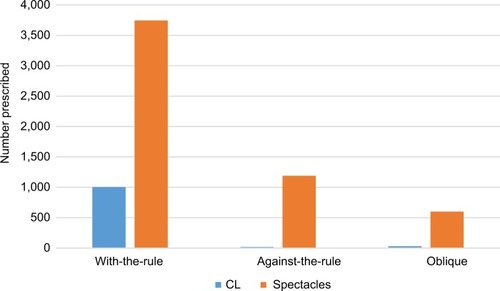
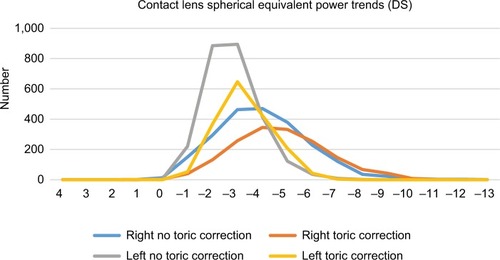
Figure 5 Group 4 spherical equivalent contact lens power distribution for contact lens wearers who were not prescribed toric lenses when they had clinically significant astigmatism, and those who were prescribed toric lenses.