
Figures & data
Figure 1 Representative TF images from the subjects within the study group.
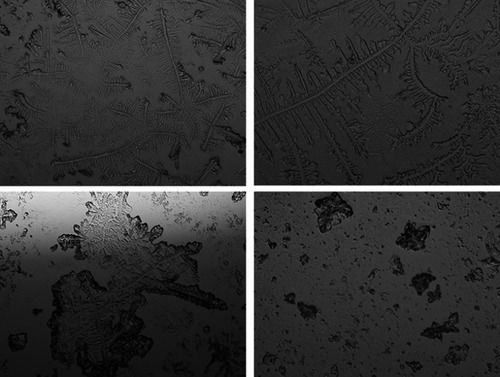
Figure 2 Side-by-side boxplots for the OSDI scores within the study and control groups.
Abbreviation: OSDI, ocular surface disease index.
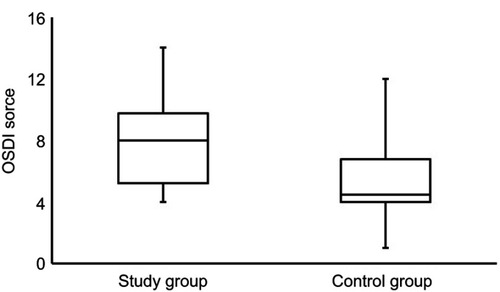
Figure 3 Side-by-side boxplots for the NITBUT scores within the study and control groups.
Note: Statistically significant value at P<0.05.
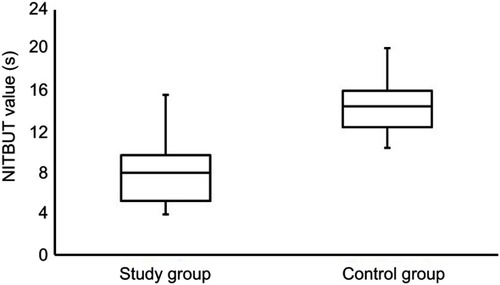
Figure 4 Side-by-side boxplots for the TMH scores within the study and control groups.
Abbreviation: TMH, tear meniscus height.
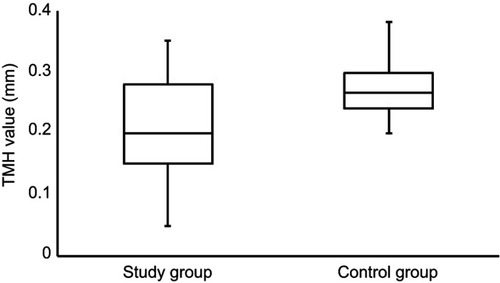
Figure 5 Side-by-side boxplots for the PRT scores within the study and control groups.
Abbreviation: PRT, phenol red thread.
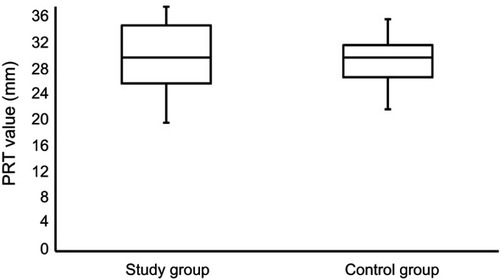
Figure 6 Side-by-side boxplots for the TF grades within the study and control groups.
Note: Statistically significant value at P<0.05.
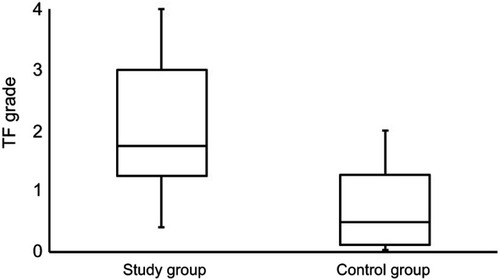
Table 1 Averages [mean ± standard deviation or medians (interquartile range)] for the OSDI, NITBUT, TMH, PRT, and TF measurements within the study and control groups
Table 2 The correlation between age, and the BMI, OSDI, NITBUT, TMH, PRT, and TF scores within the study group (n=20)