
Figures & data
Table 1 Mean And Standard Deviation (SD) Of Measured IOP Using Different Tonometers (n=94 Eyes)
Figure 1 Agreement of the bIOP with the IOP measured using Icare (upper), GAT (middle) and IOPcc (lower). (n=94 eyes) The mean difference is shown by a solid horizontal line, while the 95% limits of agreement, zero mean difference and the regression line are indicated by dashed horizontal and oblique lines, respectively.
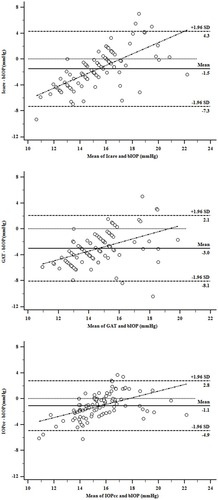
Table 2 Mean And Range Of Differences Between bIOP And Other IOP Measurements In mmHg, And 95% Limits Of Agreement (n= 94 Eyes)
Table 3 Mean And Standard Deviation Of IOP (mmhg) In Small (<540 µm) And Large (≥540 µm) Central Corneal Thickness (n=94)