Figures & data
Table 1 Mean and SD for Corneal Densitometry at Pre-Treatment and Post Treatment at 3, 6, 12 Months for Adult Group
Table 2 Mean and SD for Corneal Densitometry at Pre-Treatment and Post Treatment at 3, 6, and 12 Months for Juvenile Group
Figure 1 Corneal densitometry diversity at 3, 6 and 12 months post treatment for both groups. (A) Adult and (B) Juvenile in the different corneal zones and layers (* significant from pre-treatment and # represent significant from 3 months post treatment at level P<0.05).
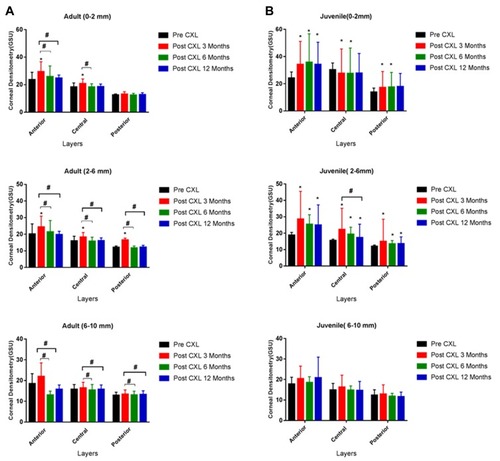
Figure 2 Corneal thickness (CCT) and thinnest area (THA) diversity between pre-treatment and all post-treatment period at each group.
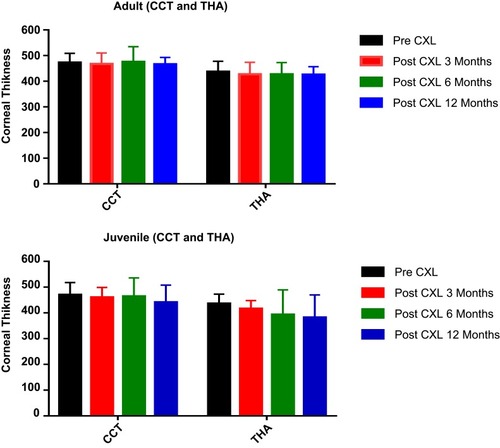
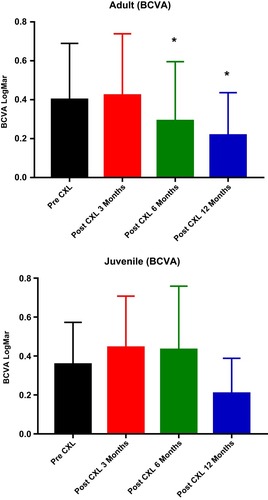
Figure 3 Diversity on BCVA between pre-treatment and post-treatment both in the adult and juvenile groups (*significant from pre-treatment at P<0.05).