
Figures & data
Figure 1 Multimodal imaging of a patient with STGD1 and macular involvement. Color fundus photograph (A), near-infrared-autofluorescence (B) and short wavelength fundus autofluorescence (C). Absence of RPE is visible as an area of irregular hyopoautofluorescence on fundus autofluorescence. Several hyperautofluorescence lesions at the macula correspond to the flecks. The OCT scan (D) centered on the fovea shows atrophy of RPE and ellipsoid zone and backscattering.
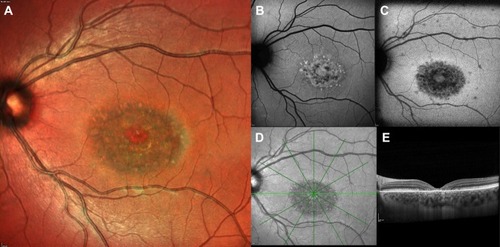
Figure 2 Ultra-widefield fundus photograph and autofluorescence of an advanced form of STGD1. The area of RPE mottling is comprised between the vascular arcades and broadens nasally to the optic disc (A, B). The macular area shows a marked hypofluorescence, with a little amount of foveal sparing (C). The OCT scan (C) demonstrates irregularity in the subfoveal RPE-photoreceptors complex and extensive atrophy in RPE and external retinal layers in the peri- and para-foveal areas. Foveal sparing is better seen on near-infrared autofluorescence (D) rather than short wavelength autofluorescence (E).
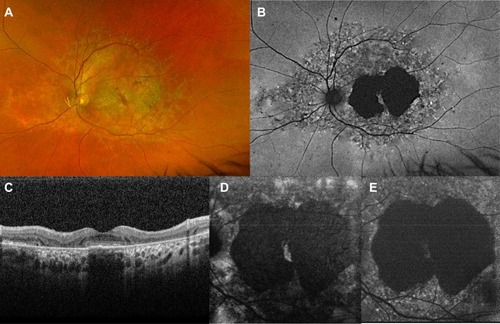
Table 1 Classifications of Stargardt Disease. The Groups Proposed Do Not Always Correspond to Different Progressive Stages of the Disease but Have Important Implications in the Clinical and Functional Assessment of the Patients
Figure 3 Progression of STGD1. First row: Short wavelength autofluorescence, Multicolor imaging, and OCT at baseline. Second row: Short wavelength autofluorescence, Multicolor imaging, and OCT after 12 months, showing enlargement of the area of RPE and photoreceptor loss on autofluorescence and central retinal thinning the foveal area.
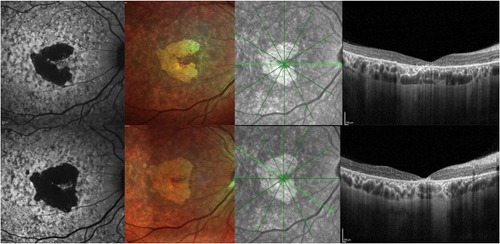
Figure 4 Comparison between short wavelength autofluorescence and near-infrared autofluorescence. Preservation of RPE in the foveal region is clearer on multicolor (A, B) and near-infrared autofluorescence (C, D) than on short wavelength autofluorescence (E–F), as the dark signal in the fovea in the latter due to blockage of normal choroidal fluorescence might be misinterpreted as RPE atrophy in the macular region.
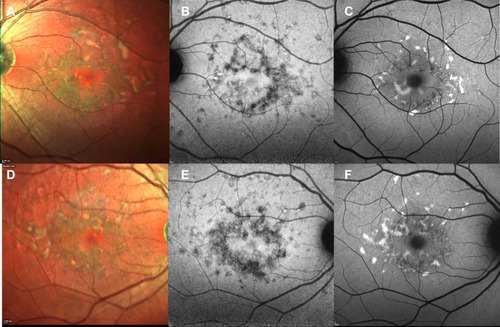
Figure 5 Foveal cavitation in STGD1. Short wavelength autofluorescence (A) and near-infrared autofluorescence (B) show macular mottling of RPE. In OCT (C), foveal cavitation appears as a hollow subfoveal space due to focal loss of RPE and photoreceptors with backscattering effect. External limiting membrane is preserved.
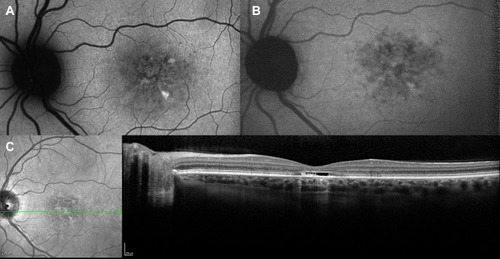
Figure 6 Choroidal neovascularization in STGD1. Fundus autofluorescence (A) shows hyperautofluorescent flecks s and irregular macular hypoautofluorescence. Early (B) and late (C) fluorescein angiography frames demonstrate a parafoveal focal dye leakage, corresponding to a type 1 choroidal neovascularization (CNV). OCT scan (D) reveals growth of the CNV above the RPE with mild exudation, along with focal irregularity/atrophy of RPE/ellipsoid zone layers.
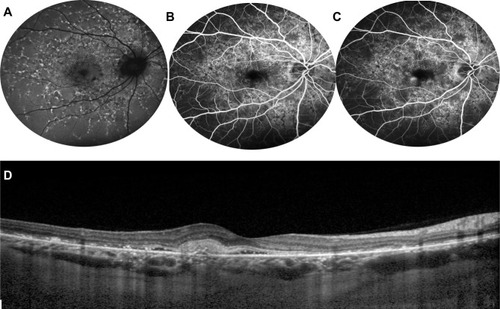
Figure 7 Optical coherence tomography angiography of STGD1. OCT angiography (left) shows foveal avascular zone enlargement and reduced vessel density on superficial capillary plexus (A) and deep capillary plexus (B), as well as damaged choriocapillaris (C). (D) Shows the corresponding autofluorescence.
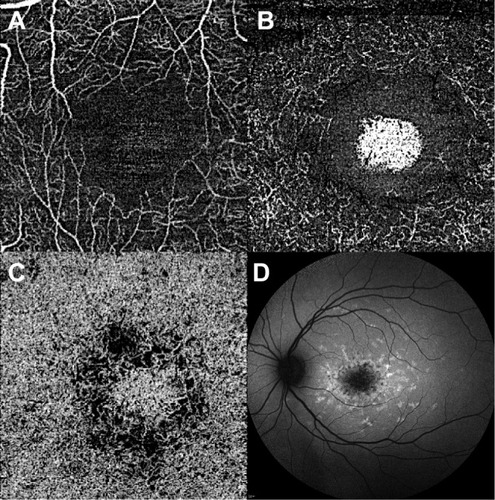
Table 2 Treatment Currently Under Investigation for Stargardt Disease