Figures & data

Table 1 Variables to Derive Spectacle Comparison GRADE Match
Figure 1 J0 vs J45 vector transformed astigmatism A, B, and C matched degraded visual acuity. Example subjects with cyl 0.5, 1.0, 1.5, 2.25 contact lens, 2.50, and 5.25 D. The lower graph shows an example spectacle with cylinder axis converted to 45° such that orientation of the concentric A-Grade, B-Grade, and C-Grade ovals have the long axis “a” oriented horizontally.
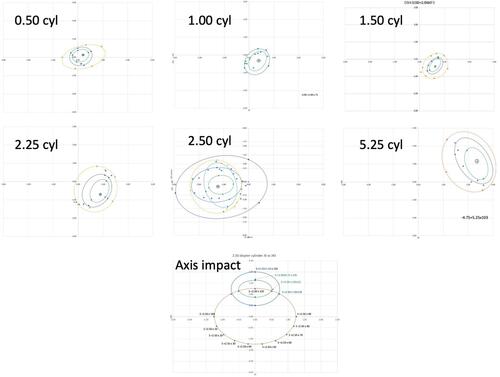
Figure 2 J0 vs J45 ovals and grades. Method to rotate target to 45° so horizontal and then generate oval boundaries (green A, blue B, and orange C to determine whether a candidate refraction, also rotated, is within a given visual acuity-derived Grade level comparison.
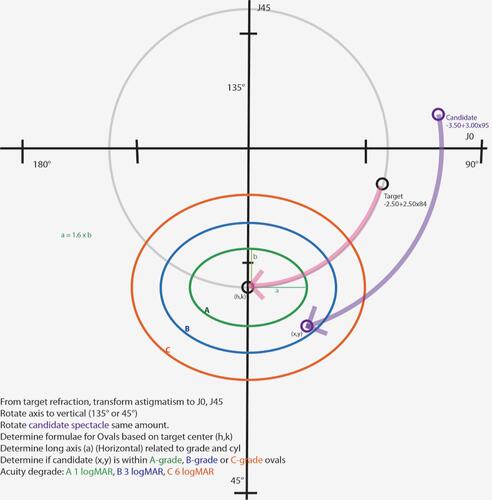
Figure 3 Linear relationship between A-match (green), B-match (blue), and C-match (orange) visual acuity degrades 1 logMAR, 3 logMAR, and 6 logMAR. Diameter of degrade limits versus cylinder power. The slope and intercept for derived long axis length versus cylinder (upper left graph) is related to Grade (upper right graphs). The slope and intercept (lower left) of over-minus spherical equivalent Grade is related to age (lower right).
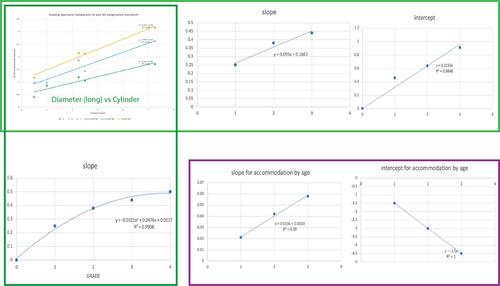
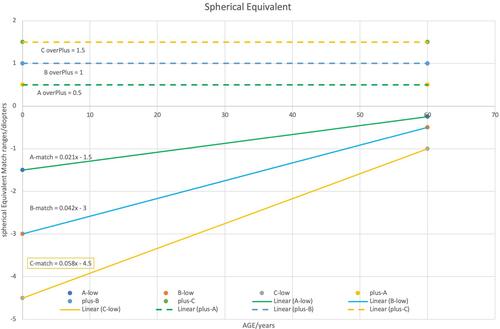
Figure 4 Spherical equivalent match related to age and accommodation. Over plus produces similar distance blur at all ages while over minus is better tolerated by young patients. A-match (green), B-match (blue), and C-match (orange) visual acuity degrades 1 logMAR, 3 logMAR, and 6 logMAR.