Figures & data
Table 1 Mean and Standard Deviation of the Tear Evaporation Rate (g/M2/h) Tear Break-Up Time (Sec) and Meniscus Height (Mm) Measured Before and at Different Time Points After Instillation of Cationic Emulsion
Figure 1 A box plot showing evaporation rate measured at different time points pre and post instillation of cationic emulsion.
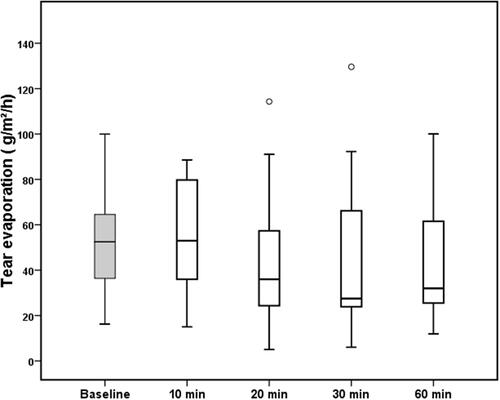
Figure 2 A box plot showing tear break up time measured at different time points pre and post instillation of cationic emulsion.
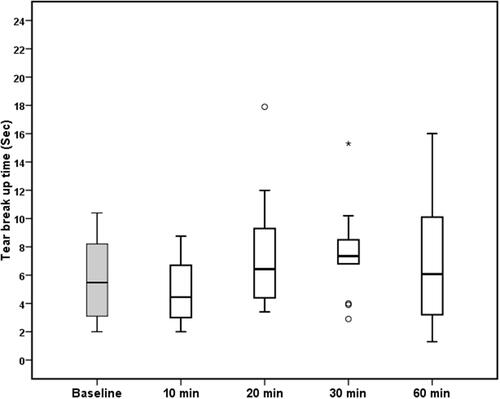
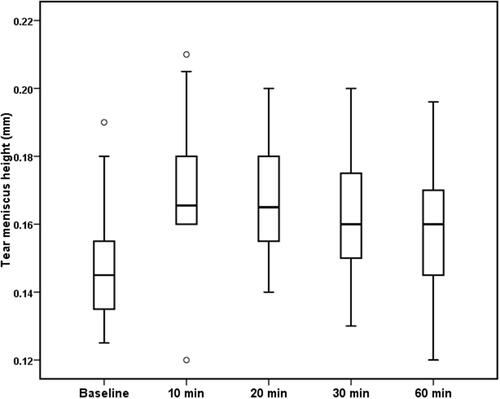
Figure 3 A box plot showing tear meniscus height measured at different time points pre and post instillation of cationic emulsion.