
Figures & data
Figure 1 Possible reference points when determining diameters of the cornea and anterior chamber.
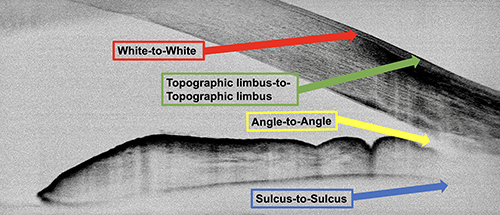
Table 1 Descriptive Data of the Average Values of Three WTW Corneal Diameter Measurements at Each Time Point Assessed in mm with Three Different Methods: Median (1st Quartile – 3rd Quartile), Mean ± Std. Deviation, n = 20
Figure 2 Boxplots for the horizontal white-to-white corneal diameter values measured with the three different methods at the three different measuring times (n = 20).
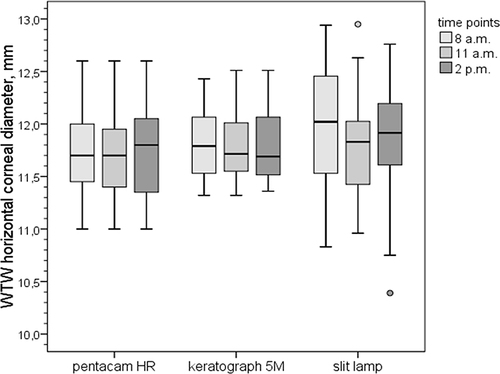
Figure 3 Bland Altman plots to describe the agreement between the measurements with the different devices (n = 20): (A) between slitlamp and Pentacam HR; (B) between slitlamp and Keratograph 5M; (C) between Pentacam HR and Keratograph 5M.
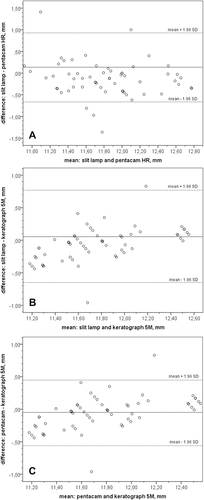
Table 2 Repeatability of the Three Measurement Methods Described by the Non-Parametric Coefficient of Variation, QCD and the Intra-Class Correlation Coefficient (ICC): Median (1st Quartile – 3rd Quartile) for QCD and Mean (95% CI) for ICC, n = 20. Three Measurements Were Performed at Each Time Point with Each Device. Their Average Values are Shown in
Table 3 Descriptive Data of the Average Values (Statistical Median) of Further Corneal Biometric Parameters Measured in the Study: Median (1st Quartile – 3rd Quartile), n = 20