Figures & data
Table 1 Descriptive Statistics of the Total Sample
Figure 1 An indicative screen capture of the new digital reading speed app with 3 - syllable unrelated words (in the middle of the screen). At the top of the screen the start button is displayed and the finish button at the bottom.

Figure 2 Association between MNread and 2SYL SPEED.

Figure 3 Association between MNread and 3SYL SPEED.
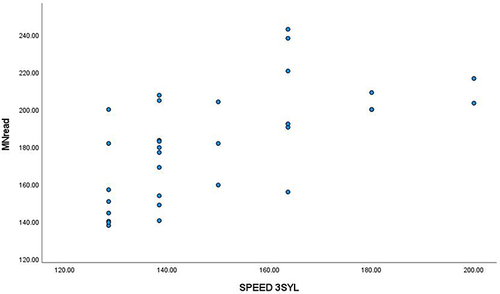
Table 2 Descriptive Statistics of Age, VA, 2SYL SPEED, 3SYL SPEED, Print Size and Index for the Three Groups
Table 3 Relationship Between Disease Status and Gender
Table 4 Linear Regression Estimates for the Difference in 2SYL SPEED, 3SYL SPEED, PRINT SIZE and INDEX Between Diseased and Normal Individuals Adjusted for Age and VA
Table 5 Mean Estimates for the Three Groups for 2SYL SPEED, 3SYL SPEED, PRINT SIZE, INDEX 2SYL and INDEX 3SYL Adjusted for Age and VA. Mean Estimates Derived from Separate General Linear Models Having Each Time as Response One of the Variables in the First Column While Patient Group, Age, and VA Were Used as Predictors. Fisher’s Least Significant Difference (LSD) Was Used to Adjust for Multiple Testing
Table 6 LSD Adjusted Pairwise Comparisons Between the Three Groups
Figure 4 Boxplot of 2-syllable words/min speed for the three subject groups.
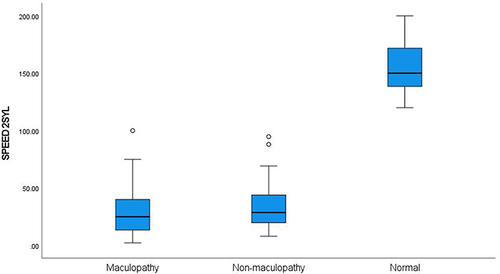
Figure 5 Boxplot of 3-syllable words/min speed for the three subject groups.
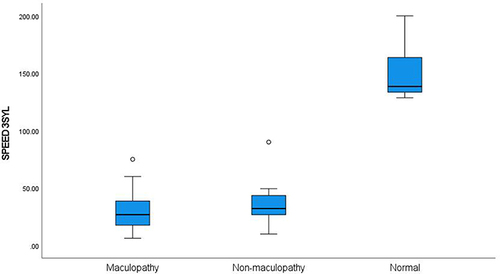
Table 7 Results of Bland Altman Analysis of Agreement Test-Retest of 2SYL and 3SYL Speed
Figure 6 Bland-Altmann plot. Test-retest of 2-syllable words/min speed for patients.
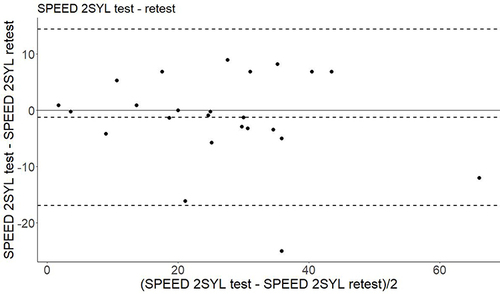
Figure 7 Bland-Altmann plot. Test-retest of 2-syllable words/min speed for healthy individuals.
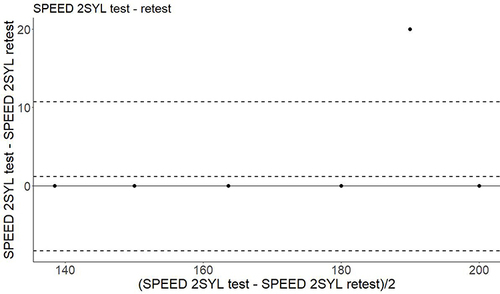
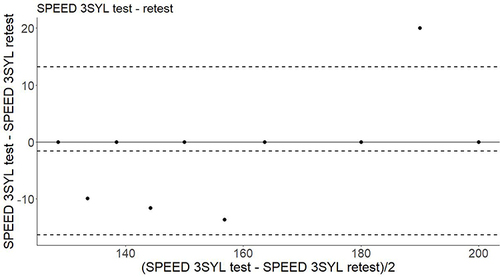
Figure 8 Bland-Altmann plot. Test-retest of 3-syllable words/min speed for patients.
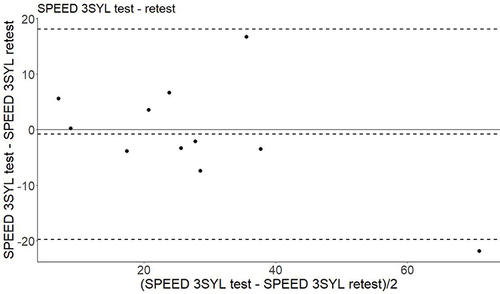
Figure 9 Bland-Altmann plot. Test-retest of 3-syllable words/min speed for healthy individuals.