
Figures & data
Table 1 The Frequency Distribution of Studied Students Regarding Their Personal Characteristics’ (n=310)
Figure 1 Percentage distribution of studied students regarding their faculty (n=310).
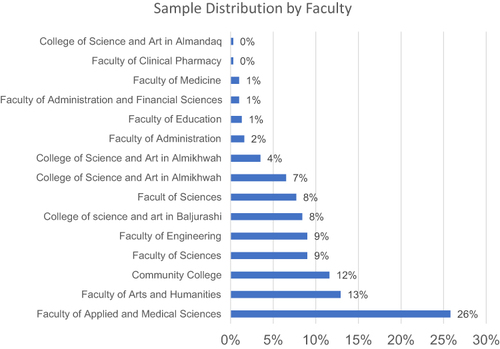
Figure 2 Percentage distribution of studied students regarding their source of information computer vision syndrome (n=310).
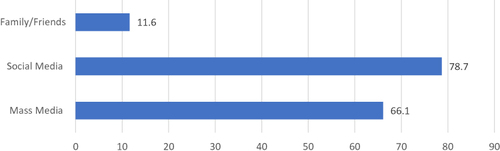
Table 2 Frequency Distribution of Studied Students Regarding Their Knowledge About Computer Vision Syndrome (n=310)
Table 3 Statistically Relation Between Total Knowledge Level and Personal Characteristics Among Studied Students
Table 4 Frequency Distribution of Studied Students Regarding Their Practices Toward Computer Vision Syndrome (n=310)
Table 5 Frequency Distribution of Studied Students Regarding Their Attitude Toward Computer Vision Syndrome (n=310)
Table 6 Statistically Relation Between Total Practices Level and Personal Characteristics Among Studied Students
Table 7 Statistically Relation Between Total Attitude Level and Personal Characteristics Among Studied Students
Table 8 Correlation Matrix Between Total Level Knowledge, Practices, and Attitude Among Studied Students