
Figures & data
Figure 1 Study design.
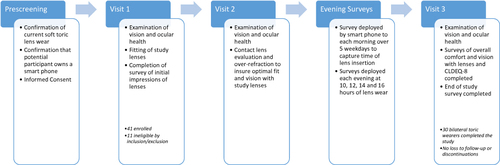
Table 1 Visual Acuity Data with Study Contact Lenses at Visit 3
Table 2 Results of Evening Surveys on a 1–10 Scale at Time Points 10, 12, 14, and 16 Hours After Lenses Were Inserted Using All Data Collected Over 5 Days of Surveys (n=29)
Table 3 Visual Analog Scale Assessments of Overall Quality of Vision, Comfort, and Dryness