
Figures & data
Figure 1 Birefringent pattern shown in the lens internal stress image with loose screw (A) and tight screw (B).
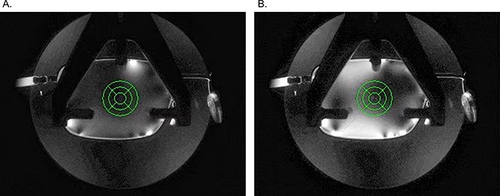
Table 1 Comparison and Agreement of Two Successive Measurements Obtained with the Digital Strain Viewer (N = 21)
Figure 2 Bland-Altman plots of two successive measurements obtained with the digital strain viewer in nine zones.
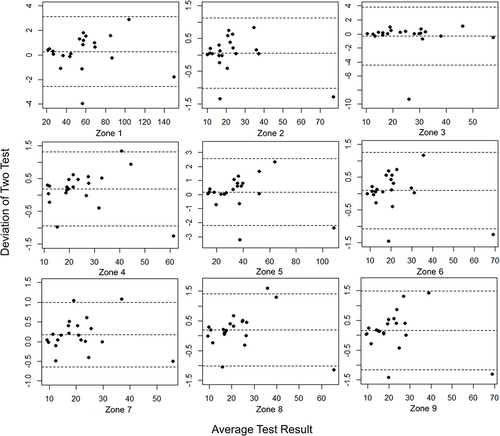
Table 2 Description and Comparison of the Internal Stress Differences of Myopia Spectacle Lenses (N = 60)
Figure 3 Lens zone numbering method of the mounted spectacle from the digital strain viewer image in a different mounting state (interior view). The tested lens was divided into nine zones by three concentric circles and two intersecting lines. The diameters of the concentric circles are 3, 6, and 9 mm. The angle between the two lines is 90°. The medians of the internal lens stress in the different zones are placed inside the brackets below the zone number. (A) Loose mounting. (B) Tight mounting.
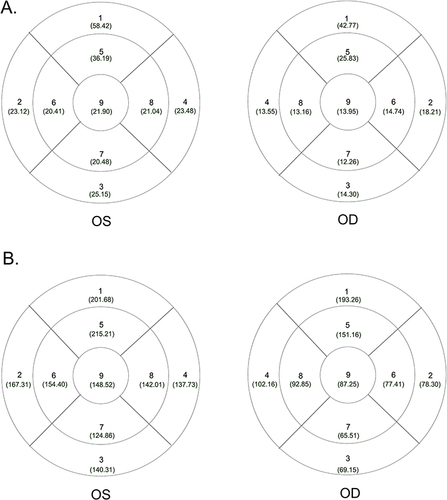
Figure 4 Box plots of the internal lens stress distribution in the different zones. Statistically significant differences between the different zones after the post hoc tests are marked with lines and asterisks. (A) Vertically arranged zones. (B) Horizontally arranged zones. * P<0.05.
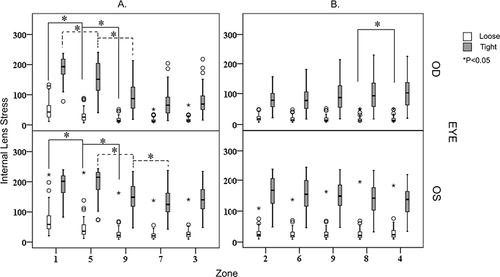
Table 3 Comparisons of the Central Residual Refractive Errors and Visual Image Quality Parameters of the Corrected Eyes Between Loose- and Tight-Mounted Spectacles (N = 60)