334
Views
2
CrossRef citations to date
0
Altmetric
ORIGINAL RESEARCH

Effects of Lens-Induced Astigmatism at Near and Far Distances

ORCID Icon, & ORCID Icon
Pages 105-117 | Received 19 Jan 2023, Accepted 13 Apr 2023, Published online: 06 May 2023

Figures & data

Table 1 Measured Contrast

Figure 1 Scheme of the study design showing the conditions under which VA was measured, ie at far and at near distance, in photopic and mesopic conditions, at high contrast and low contrast, and for six different level of power and two different axis orientations of the added cylindrical lens.

Abbreviations: VA, visual acuity; D, diopters; WTR, astigmatism with-the-rule; ATR, astigmatism against-the-rule; HC, high contrast; LC, low contrast.
Figure 1 Scheme of the study design showing the conditions under which VA was measured, ie at far and at near distance, in photopic and mesopic conditions, at high contrast and low contrast, and for six different level of power and two different axis orientations of the added cylindrical lens.

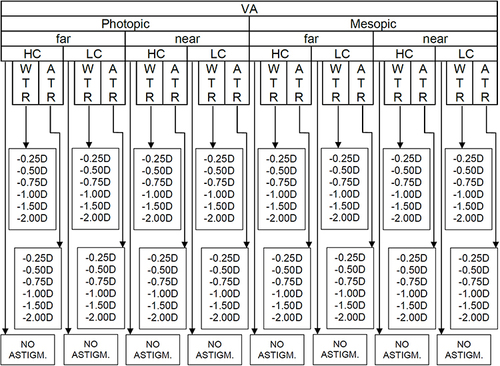
Table 2 Preliminary Assessment

Figure 2 Visual acuity (logMAR) of one participant measured at far and at near distance, in photopic (full markers) and mesopic (empty markers) conditions, for HC (squares) and LC (diamonds) stimuli at different levels of induced WTR and ATR astigmatism. The continuous lines show the results of the linear regressions of the data.

Abbreviations: D, diopters; logMAR, logarithm of minimum angle of resolution; WTR, with-the-rule; ATR, against-the-rule.
Figure 2 Visual acuity (logMAR) of one participant measured at far and at near distance, in photopic (full markers) and mesopic (empty markers) conditions, for HC (squares) and LC (diamonds) stimuli at different levels of induced WTR and ATR astigmatism. The continuous lines show the results of the linear regressions of the data.

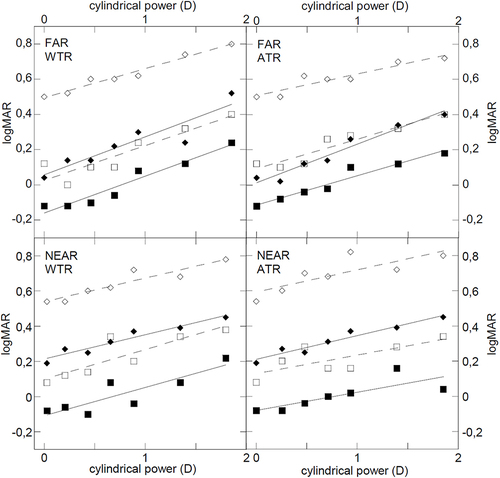
Table 3 VA Degradation vs Myopia Level

Figure 3 (a) Mean slopes indicating the visual acuity (A) drop induced by astigmatism (WTR and ATR) at far and at near distance, for HC and LC stimuli, in photopic and mesopic conditions. (b) Mean DoF calculated as one tenth of the reciprocal of the slopes, thus representing the cylindrical power which produces a 0.1 logMAR worsening of the visual acuity. The bars indicate the standard deviations of the data.

Abbreviations: DoF, depth of focus; D, diopters; D−1, diopters−1; WTR, astigmatism with-the-rule; ATR, astigmatism against-the-rule; HC, high contrast; LC, low contrast.
Figure 3 (a) Mean slopes indicating the visual acuity (A) drop induced by astigmatism (WTR and ATR) at far and at near distance, for HC and LC stimuli, in photopic and mesopic conditions. (b) Mean DoF calculated as one tenth of the reciprocal of the slopes, thus representing the cylindrical power which produces a 0.1 logMAR worsening of the visual acuity. The bars indicate the standard deviations of the data.

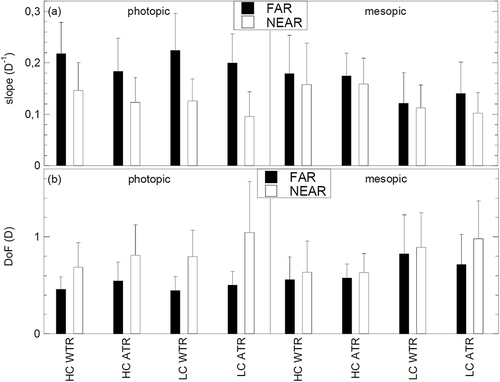
Table 4 Far vs Near Comparison

Table 5 WTR vs ATR Comparison

Table 6 Photopic vs Mesopic Comparison

Table 7 HC vs LC Comparison