
Figures & data
Figure 1 Near addition distribution across the age groups.
Notes: Vertical line = near addition. Horizontal line = age. illustrates the result of post hoc tests which were run on the addition across the age groups and the result showed there was a significant difference in the addition across the different age groups with a p-value of <0.001.
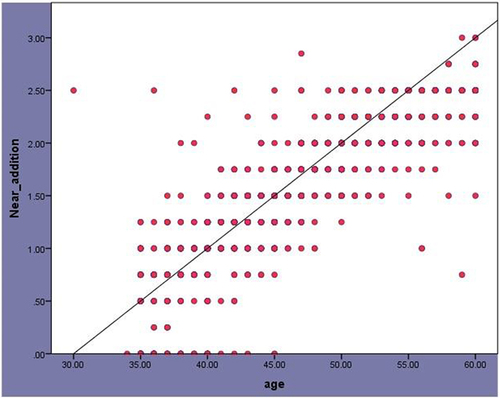
Figure 2 Comparison of the addition of different populations.
Notes: Vertical line = near addition values. Horizontal line = age groups. The variation in addition for these populations is illustrated in .
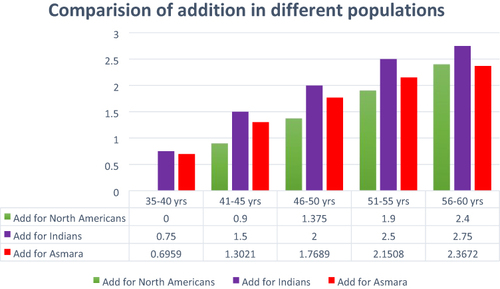
Table 1 Demographic Distribution of Participants
Table 2 Prevalence of Presbyopia in Different Variables
Table 3 Multivariate Analysis of the Factors Affecting Presbyopia Age Adjusted and Non- Adjusted
Table 4 Addition Table for the Different Genders Across the Age Groups
Table 5 Near Addition to Different Refractive Status
Table 6 Predictive Factors for Addition