Figures & data
Table 1 Sampling of Patients in the Biofeedback Group and in the Control Group
Table 2 Outcomes of Patients Undergoing Rehabilitation Therapy with MBFT (Biofeedback Group) Characterized by Central Fixation and Eccentric Fixation and Fixation Stability (%) Calculated Before and After Rehabilitation
Table 3 Clinical Evaluation of Patients in the Control Group and Biofeedback Group at T0, T1 and T4 (Mean ± SD) for the Number of Letters (ETDRS), CMT (Central Macular Thickness), MRS (Central Macular Thickness) and Fixation
Table 4 Comparison of CRVO and BRVO for the Intervals T0→T1 and T0→T4
Figure 1 Development of the LogMar variable over time.
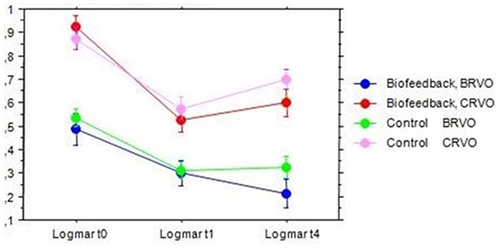
Figure 2 Time course of the ETDRS variable over time.
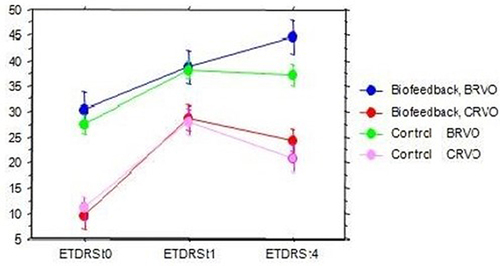
Figure 3 Development of the CMT (Central Macular Thickness) variable over time.
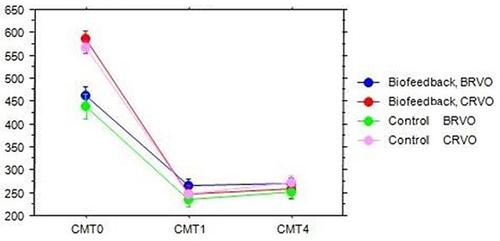
Figure 4 Development of the MRS (mean retinal sensitivity) variable over time.
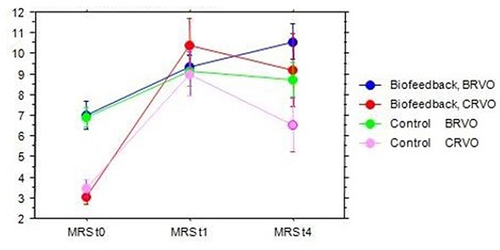
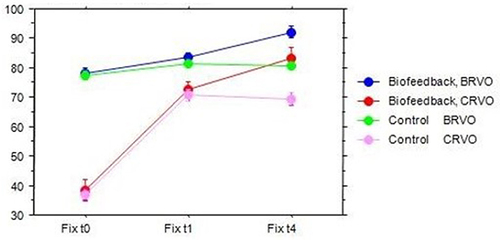
Figure 5 Development of the Fixation variable over time.