
Figures & data
Figure 1 Outline of study visits.
Abbreviations: SV, single vision; MFCL, multifocal soft contact lens; D, center-distance; N, center-near.
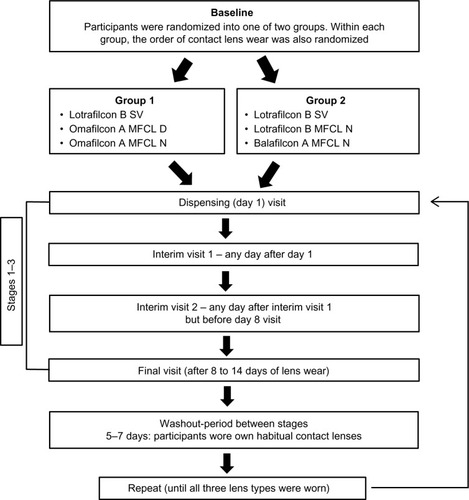
Table 1 Description of contact lenses and modality used in both groups
Table 2 Subjective response variables and the corresponding questions asked
Table 3 Binocular and monocular high-contrast visual acuity (logMAR) as measured with the different lenses at all visits
Figure 2 Mean scores for the subjective responses obtained on the final visit of lens wear.
Notes: A linear mixed model was used. Error bars indicate standard deviations of the group; *indicate significant differences (P, 0.05) when compared to the control lens (Lotrafilcon B SV), subjective response scores were measured according to the following references; with distance, intermediate, near and low illumination vision and vision while walking scored according to the following; extremely unclear/blurred =0, extremely clear/sharp =10, whereas overall comfort and comfort moving were measured according to the following references; very uncomfortable =0, very comfortable =10.
Abbreviations: SV, single vision; MFCL, multifocal soft contact lens; D, center-distance; N, center-near.
Abbreviations: SV, single vision; MFCL, multifocal soft contact lens; D, center-distance; N, center-near.
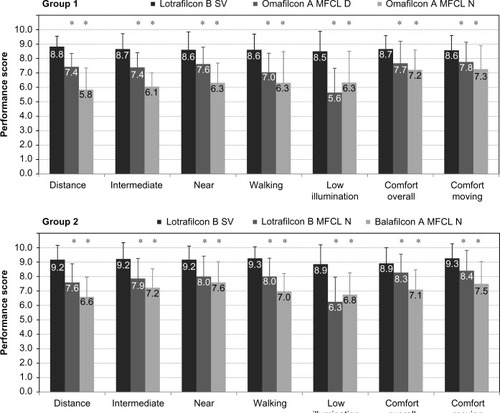
Figure 3 Contact lens centration data (average of four visits).
Notes: A Linear mixed model was used, results are statistically significant at an alpha level of 0.05.
Abbreviations: SV, single vision; MFCL, multifocal soft contact lens; D, center-distance; N, center-near.
Abbreviations: SV, single vision; MFCL, multifocal soft contact lens; D, center-distance; N, center-near.
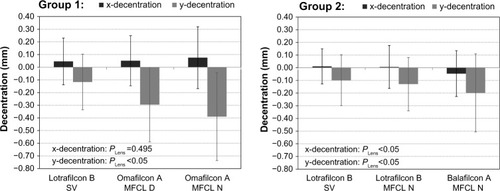
Figure 4 NIMO power profile measurements for all study lenses (distance power label −3.00 D, high add).
Notes: The power profiles of all study lenses were measured using NIMO TR1504 (Lambda-X, Nivelles, Belgium).
Abbreviations: SV, single vision; MFCLD, multifocal soft contact lens center-distance; MFCLN, multifocal soft contact lens center-near.
Abbreviations: SV, single vision; MFCLD, multifocal soft contact lens center-distance; MFCLN, multifocal soft contact lens center-near.
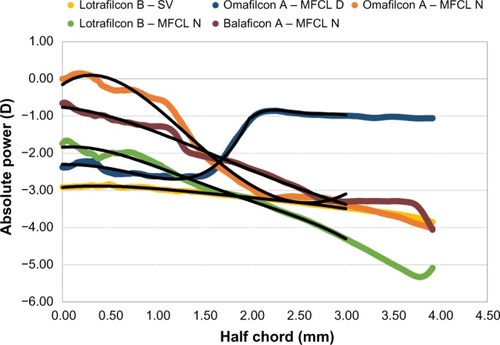
Table 4 Fourth-order polynomial fits for the different study lenses and the calculated area under the distance corrected power profiles between the half chords of 0.00 and 3.00 mm