
Figures & data
Table 1 Characteristics of the Study Cohort at Baseline
Figure 1 Decrease in pain over time, measured through a visual analogue scale (VAS). The decrease is statistically significant (p<0.05) from baseline to 6 months and 12 months.
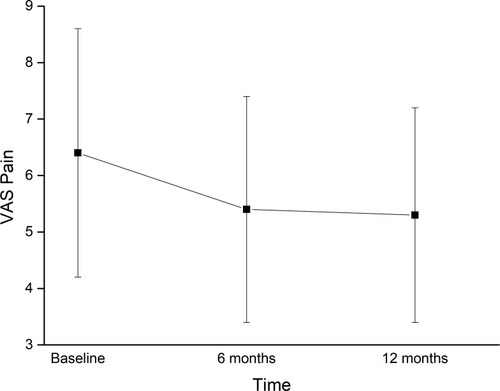
Figure 2 Decrease in Lequesne index over time. The decrease is statistically significant (p<0.05) both from baseline to 6 and 12 months, and between 6 and 12 months.
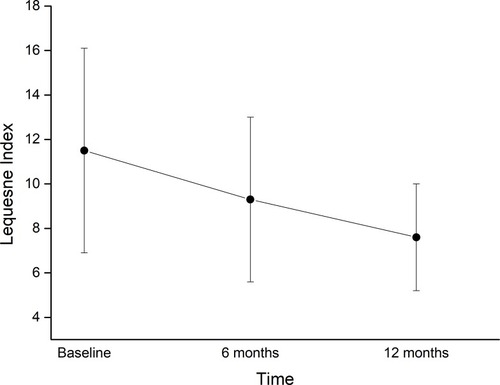
Figure 3 Decrease in NSAID consumption over time, measured in days/months. The decrease is statistically significant (p<0.05) both from baseline to 6 and 12 months, and between 6 and 12 months.
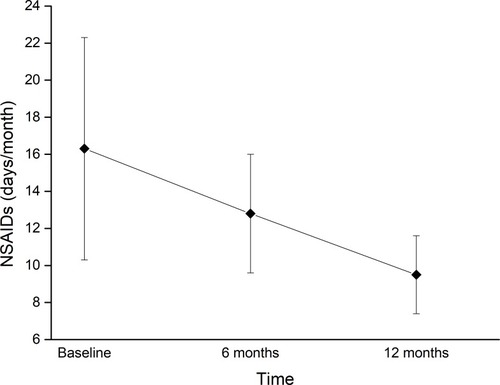
Table 2 Pain VAS, Lequesne Index, and NSAID Consumption Variation Over Time