
Figures & data
Figure 1 Flowchart of search strategy according to the Preferred Reporting Items for Systematic Reviews Aand Meta-analysis guidelines.
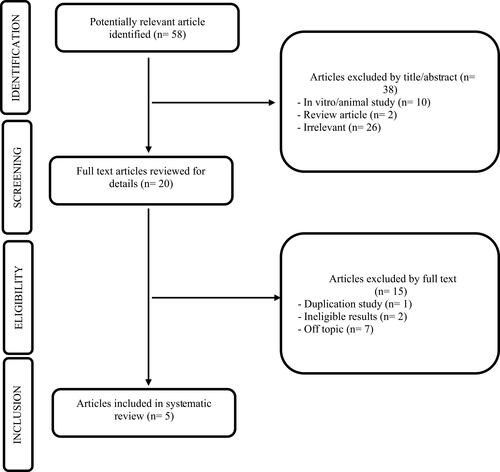
Table 1 General Characteristics of Included Studies
Table 2 Pain Assessment (VAS) and Functional Outcome Scores for All Patients
Table 3 Pain Assessment (VAS) and Functional Outcome Scores for BTD and RP Groups
Table 4 Range-of-Movement Assessment for All Patients
Table 5 Healing Status
Table 6 Retear Rate in BTD Group vs RP Group