Figures & data
Figure 1 PET/CT image showing hyperdense lesions in the anterior and posterior right thigh. Views are anterior (left) and right lateral (right).
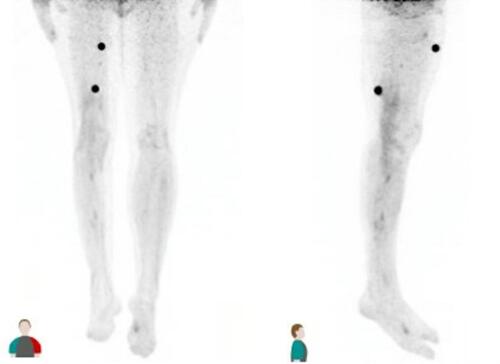
Figure 2 T1-weighted MRI showing interval enlargement of posterior thigh mass from 1.6 by 1.4 cm (left image) to 2.2 by 1.6 cm (right image), images were taken approximately 6 months apart.
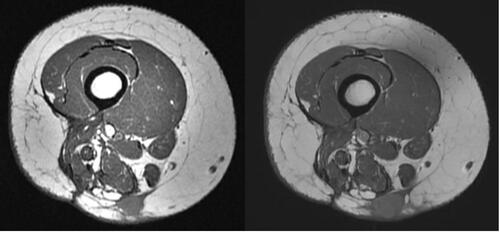
Figure 3 Surgical resection of the posterior thigh mass.
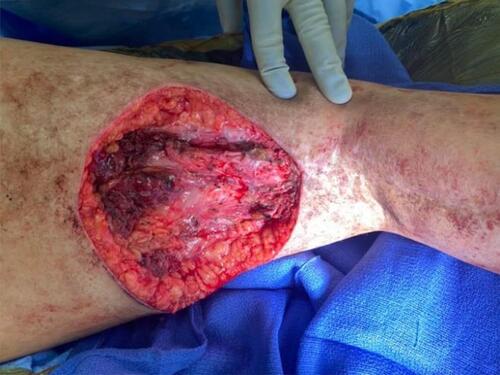
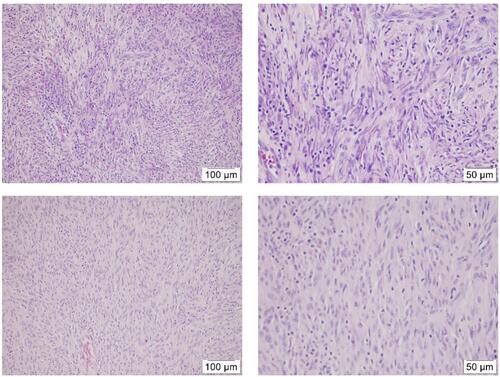
Figure 4 Resected tumors from the patient’s anterior thigh (top) and posterior thigh (bottom) as viewed under 20× and 40× objective lens. Both masses display a storiform architecture of spindle cells with ovoid nuclei in collagenous stroma, most consistent with the known “compact spindle cell pattern” of IMT.