
Figures & data
Figure 1 Preoperative plan. (A) A schematic to illustrate a distal femur sarcoma enclosed by line segments AB-BC-CD in the coronal plane. (B) Three target resection planes extended anteriorly and posteriorly from AB-BC-CD that were orthogonal to the coronal plane. These are called Plane 1, 2, and 3, as illustrated.
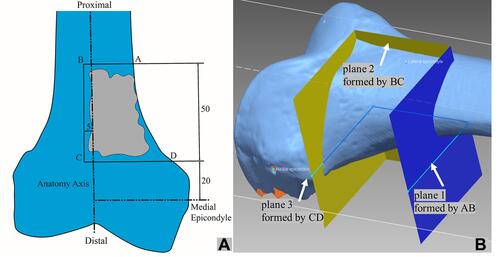
Figure 2 The conventional method: A standard procedure for wide resection in orthopaedic oncology in which surgeons tried to reproduce the osteotomy lines in reference to known palpable/visible external landmarks on the bone, and draw the three osteotomy line segments on the bone using a marking pen to reproduce the preoperative plan.
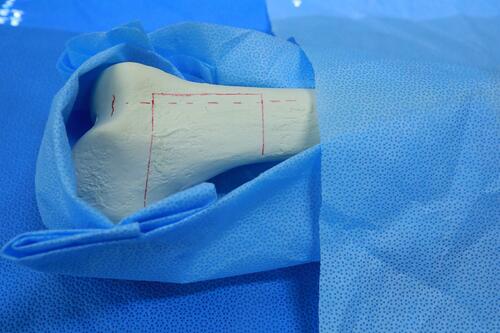
Figure 3 (A) An illustration of limited exposed area (about 30×30 mm2) of the distal femur, marked with the “X” pattern. (B) A light pattern is projected onto the surface area of the bone marked with the “X” pattern. The distorted light pattern on bone surface is captured by camera.
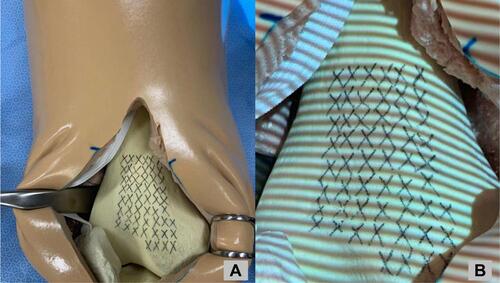
Figure 4 (A) An image of scanned surface with the patterned light, marked with “X”. (B) The scanned surface is registered to the CT-scan model by a surface matching algorithm. (C) After the registration is done, the three preoperatively resection planes were superimposed onto the extracted bone surface, in reference to the “X” marks, to serve as a visual aid for the surgeon to accurately reproduce and draw the preoperative plan.
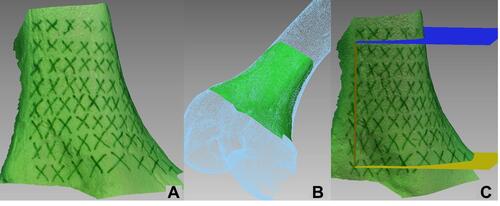
Figure 5 Evaluate the navigation accuracy: (A) post-operative surface scanned image is first aligned with reference CT-scan model. After that, the osteotomy lines drawn by a surgeon is compared with the reference CT-scan model in coronal view to assess the navigation accuracy. (B) The result of the 3D-LAD method: the osteotomy lines drawn by a surgeon is in red color (with “X” grid as a visual aid), to compare with the cyan line segments; (C) the result of traditional manual method: the osteotomy lines drawn by a surgeon is in red color, to compare with the cyan line segments.
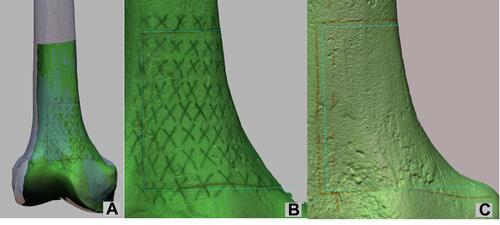
Figure 6 Definitions of terminology to measure errors: (A) the “corner deviation” is defined as the displacement error at the corner B or C between the CT-scan reference and the osteotomy lines drawn by a surgeon in the coronal plane, as shown. The “front angle” is the angular displacement of the AB or CD line segment between the CT-scan reference and the best-fit line of the drawn path in the coronal plane, as illustrated with CD line segment in the figure. (B) Many points on the resected bone surface corresponding to line segments AB, BC, and CD are sampled. Each sampled point, as shown, has a distance from the reference preoperative CT-scanned planes extended by AB, BC, CD lines (cf. plane 1, 2 and 3 in ), respectively. The “max deviation” is defined as the maximum distance of deviation among all sampled points with a deviation (as shown), with respect to each corresponding plane. The results of maximum deviation are listed in Table A3 in the Appendix.
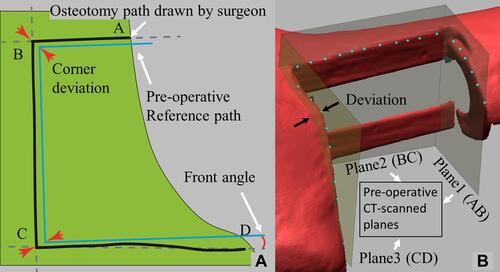
Table 1 Summary of Errors Between the Conventional and 3D-LAD Methods for Comparison