
Figures & data
Table 1 Anchor Questions
Figure 1 ROC curves for KOOS pain subscale demonstrating the effects of the anchor question upon both magnitude and precision of the MCID. (A) Anchor question derived from the VR-12. (B) Anchor question derived from PROMIS. The statistical significance (p value) applies to the measure of precision (C-index).
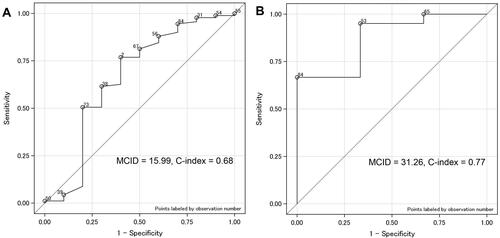
Figure 2 ROC curves for PCS function domain demonstrating the effects of the threshold criteria from a Likert scale upon both magnitude and precision of the MCID. (A) Success criteria 3–5. (B) Success criteria 4–5. The statistical significance (p value) applies to the measure of precision (C-index).
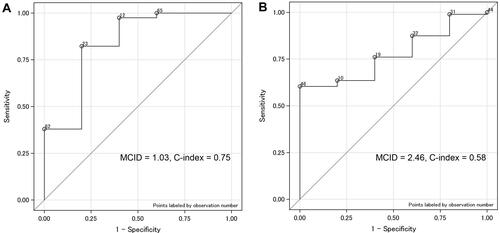
Table 2 Estimated MCID for KOOS Pain
Table 3 Estimated MCID for PCS