Figures & data
Figure 1 K-wire implantation in femoral bone.
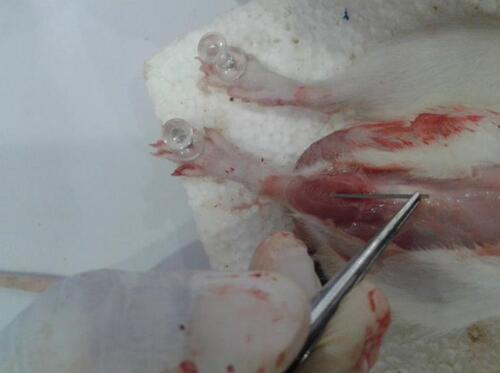
Table 1 Type I collagen numbers in groups T1 and C1
Figure 2 (A) Expression of type I collagen in tissue around implant with weak appearance; (B) expression of type I collagen in tissue around implant with moderate appearance; (C) expression of type I collagen in tissue around implants with strong appearance.
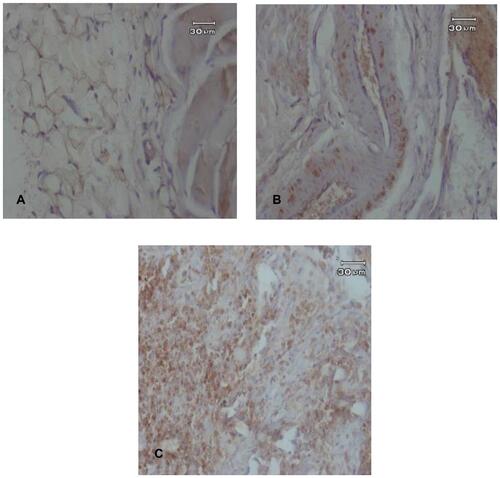
Table 2 VEGF expression and vascularization formation in groups T2 and C2
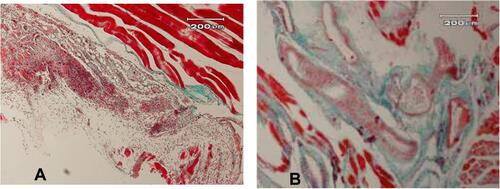
Figure 3 Histology of blood vessels in fibrotic capsule in tissue surrounding implants. (A) Implant treatment group+ PRP group (40×); (B) implant treatment group (40×).