
Figures & data
Figure 1 Patients included in this study.
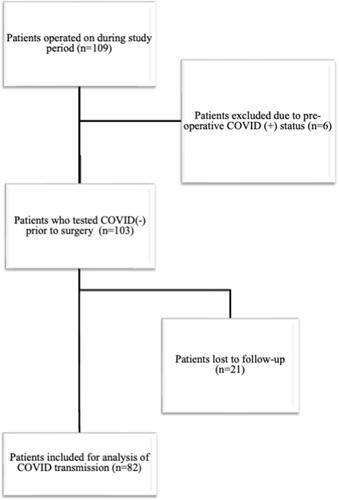
Figure 2 Types of surgical cases performed during the study period.
Abbreviations: UE, upper extremity; LE, lower extremity; I&D, irrigation and debridement; ROH, removal of hardware.
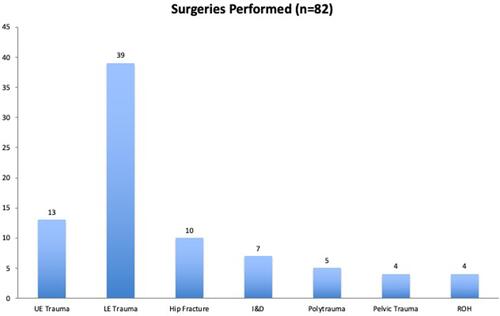
Figure 3 The percentage of inpatient hospital beds occupied by COVID-19 positive patients in each of the hospitals over the study period.
Notes: Blue diamond, hospital 1; Red square, hospital 3; Green triangle, hospital 3. Data from hospitals 1 and 3 represent weekly averages based on daily reported values, whereas hospital 2 is based on weekly reported values.
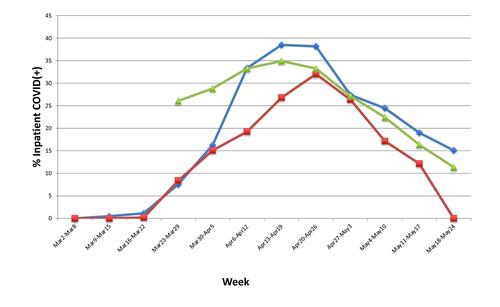
Table 1 Summary of Patient Demographics
Table 2 Risk Factors Associated with Post-Operative COVID Positive
Table 3 Comparison of Age, Length of Admission, and BMI Between Patients Who Did and Did Not Convert to COVID(+)