Figures & data
Figure 1 (A) Diabetes induction by intraperitoneal streptozotocin injection. (B) Arthritis induction in diabetic rats. Complete-Freund’s Adjuvant was injected in ankle joint space by palpating a soft spot anterolateral to the anterior tibialis tendon in a manually distracted joint.
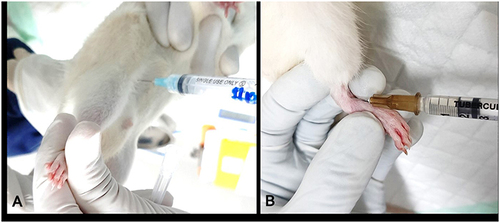
Table 1 Subject Characteristic (n=20)
Table 2 Comparison of Left Hind Limb Ankle Diameter Before and After Induction
Table 3 Comparison to Contralateral Ankle and Control Group
Figure 2 Ankle radiograph. (A) initial. (B) normal ankle after induction (Kellgren-Lawrence / KL 0) (C) KL-2, (D) KL-3, (E) KL-4.
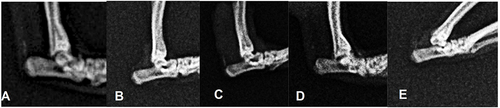
Figure 3 Histology findings in normal ankle (A–C) vs grade 3 severely arthritic ankle (C and D) with Hematoxylin-Eosin staining. (A) Talo-tibial joint space (red asterisk) in normal ankle, total magnification (TM) 40x. (B) Healthy synovium consisted of 1–2 of synovial cell linings (yellow asterix). TM 100x. (C) Synovial connective tissue showed no infiltration of inflammatory cells. TM 400x. (D) Joint space was markedly reduced with irregularity of the articular cartilage. TM 40x. (E) Synovial cells hyperplasia (yellow asterix). TM 100x. (F) Dense inflammatory cells infiltrate in synovial connective tissue. TM 400x.
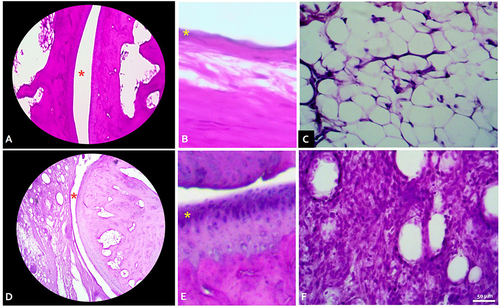
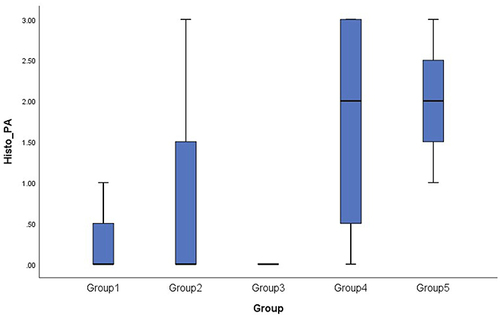
Figure 4 The boxplot graph showed a higher median in arthritic group (4 and 5) compared to control group (group 1) and diabetic only group (2, 3). Group 4 and 5 have a nearly identical medians, however, group 4 has more variability than group 5.