Figures & data
Figure 1 Structures of compound 2,2′-oxybis (4-allyl-1-methoxybenzene) or biseugenol B.
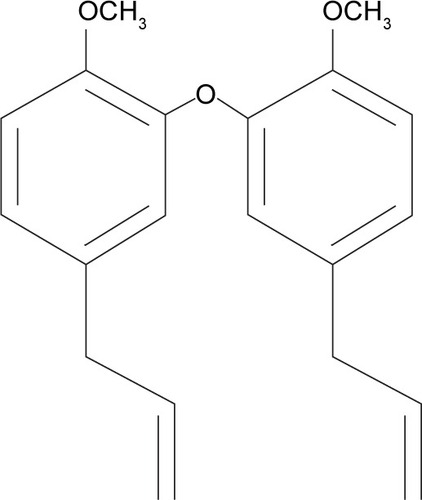
Figure 2 MTT assay growth curve of PC3 cells treated with biseugenol B at 24, 48, and 72 hours.
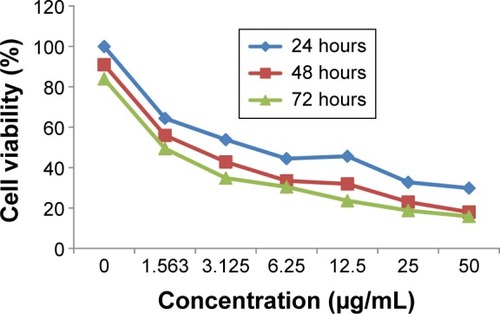
Table 1 IC50 concentration of biseugenol B
Figure 3 AO-PI double-staining cell morphological analysis in untreated and treated PC3 cells with biseugenol B.
Abbreviations: AO, acridine orange; VI, viable cells; EA, early apoptosis; LA, late apoptosis; SN, secondary necrosis; PI, propidium iodide.
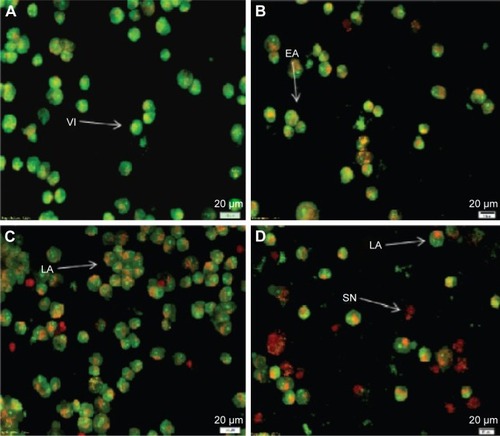
Figure 4 The percentages of VI, EA, LA and SN cells after biseugenol B treatment.
Abbreviations: VI, viable cells; EA, early apoptosis; LA, late apoptosis; SN, secondary necrosis; SD, standard deviation.
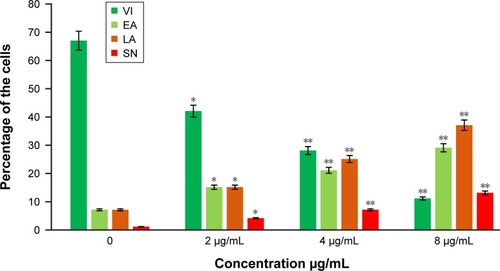
Figure 5 The effect of biseugenol B on EA and LA of PC3 cells.
Abbreviations: EA, early apoptosis; LA, late apoptosis; FITC, fluorescein isothiocyanate; AV, annexin V; PI, propidium iodide; VI, viable cells; SD, standard deviation.
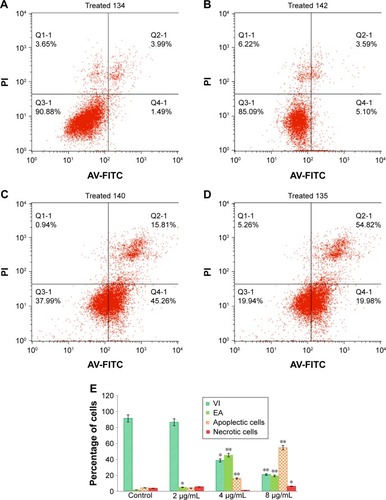
Figure 6 Cell cycle histogram from analyses of PC3 cells treated with 0 µg/mL (A), 2 µg/mL (B), 4 µg/mL (C) and 8 µg/mL (D) of biseugenol B for 24 hours. (E) Summary of cell cycle progression for control and biseugenol B-treated PC3 cells.
Abbreviation: SD, standard deviation.
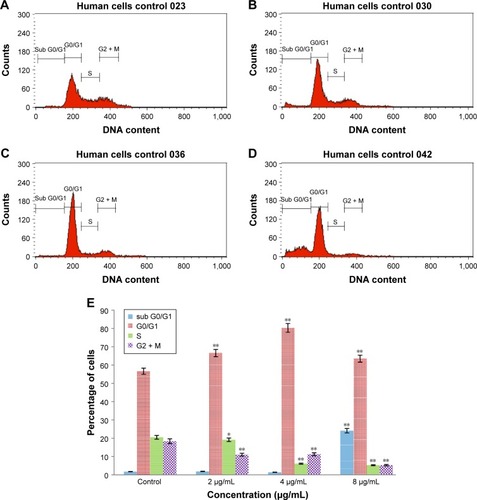
Table 2 Effect of biseugenol B on cell cycle phases
Figure 7 The effect of biseugenol B on nuclear size, MMP, cell membrane permeability, and cytochrome c release in PC3.
Abbreviations: MMP, mitochondrial membrane potential; SD, standard deviation.
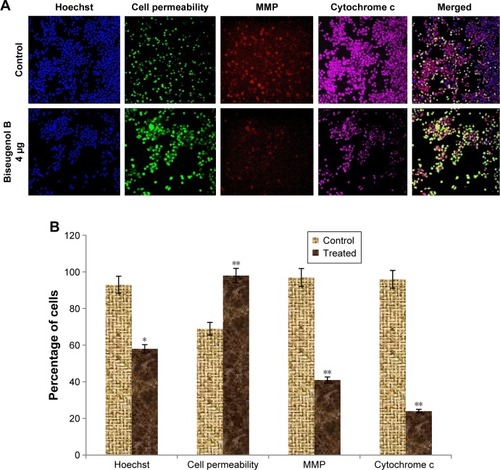
Figure 8 Relative bioluminescence expression of caspase-3/7, caspase-8, and caspase-9 in PC3 and RWPE-1 cells treated with biseugenol B.
Abbreviation: SD, standard deviation.
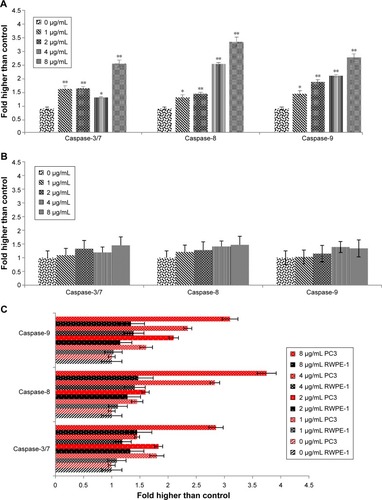
Figure 9 DCF-fluorescence intensity after exposure of biseugenol B for 24 hours in PC3 and RWPE1.
Abbreviations: ROS, reactive oxygen species; DCF, dichlorodihydrofluorescein; SD, standard deviation.
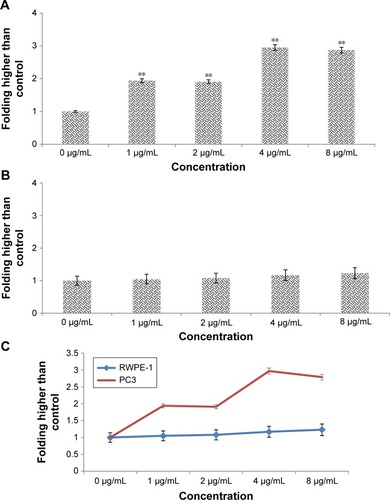
Figure 10 Effects of biseugenol B on the Bax, Bcl-2 and Hsp70 mRNA expression level in PC3 cells.
Abbreviations: Bax, Bcl-2-associated X; Bcl-2, Bcl-cell lymphoma-2; Hsp70, heat-shock protein 70; PCR, polymerase chain reaction; SD, standard deviation.
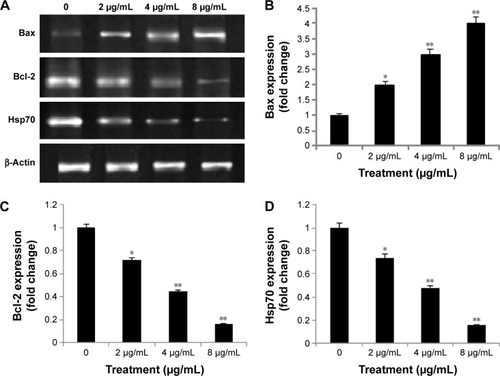
Figure 11 Western blot analysis of biseugenol B in the selected apoptotic signaling markers.
Abbreviations: Bax, Bcl-2-associated X; Bcl-2, Bcl-cell lymphoma-2; Hsp70, heat-shock protein 70; SD, standard deviation.
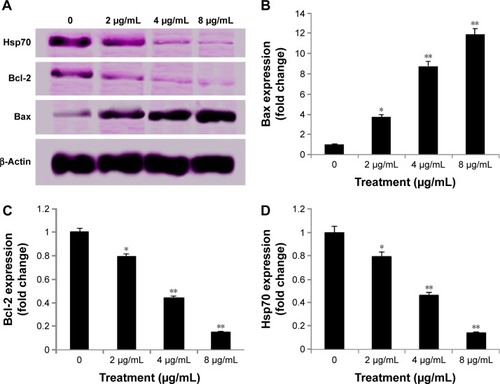
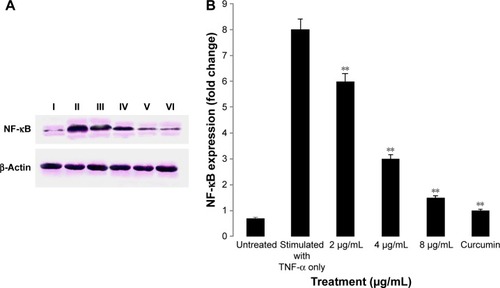
Figure 12 Inhibition of TNF-α-induced NF-κB nuclear translocation by biseugenol B.
Abbreviations: TNF-α, tumor necrosis factor-alpha; NF-κB, nuclear factor kappa-B.
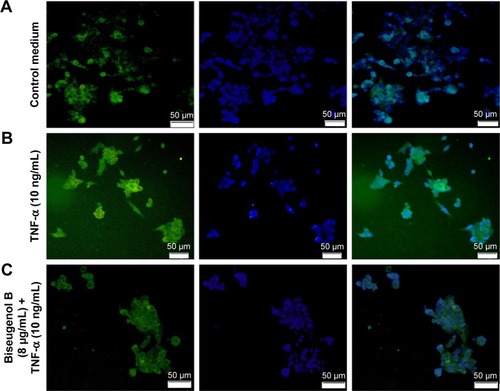
Figure 13 Immunoblot analysis of nuclear NF-κB.
Abbreviations: NF-κB, nuclear factor kappa-B; SD, standard deviation.