Figures & data
Figure 1 Flow diagram of the study selection process.
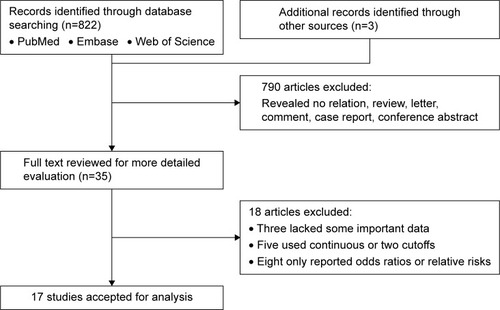
Table 1 Main characteristics of all studies included in the meta-analysis
Figure 2 Forest plots of studies evaluating hazard ratios of decreased serum albumin levels for all renal cell carcinomas RCC.
Notes: (A) A decreased serum albumin level was associated with a shorter overall survival in RCC. (B) A decreased serum albumin level was associated with shorter cancer-specific survival and shorter progression-free survival/relapse-free survival in RCC. Weights are from random effects analysis.
Abbreviations: CSS, cancer-specific survival; HR, hazard ratio; OS, overall survival; RCC, renal cell carcinoma.
Abbreviations: CSS, cancer-specific survival; HR, hazard ratio; OS, overall survival; RCC, renal cell carcinoma.
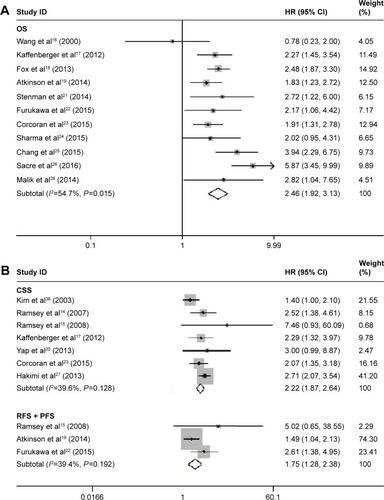
Figure 3 Forest plots of studies evaluating hazard ratios of decreased serum albumin levels for different tumor types.
Notes: (A) All-stage group. (B) Metastatic group. (C) Localized group. (D) Clear cell renal cell carcinoma. Weights are from random effects analysis.
Abbreviations: CSS, cancer-specific survival; HR, hazard ratio; OS, overall survival.
Abbreviations: CSS, cancer-specific survival; HR, hazard ratio; OS, overall survival.
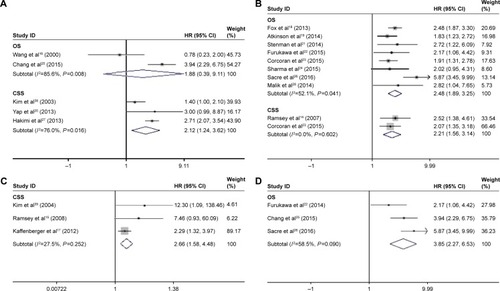
Table 2 The pooled associations between pretreatment serum albumin and the prognosis of RCC patients
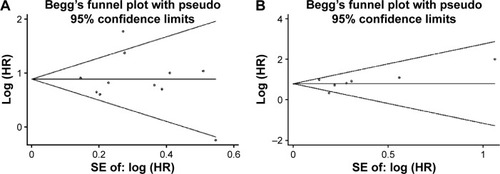
Figure 4 Funnel plots for the evaluation of potential publication bias.
Notes: (A) Overall survival for all renal cell carcinomas. (B) Cancer-specific survival for all renal cell carcinomas.
Abbreviation: HR, hazard ratio.
Abbreviation: HR, hazard ratio.