Figures & data
Figure 1 Flowchart for the computational drug design used in this study.
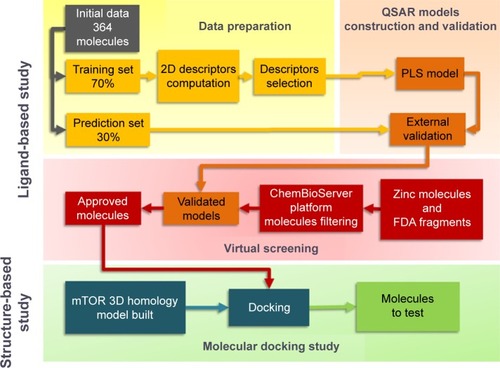
Figure 2 Fitting the experimental data in the training set to generate the quantitative structure–activity relationship model in the MOE module QuaSAR-Model.
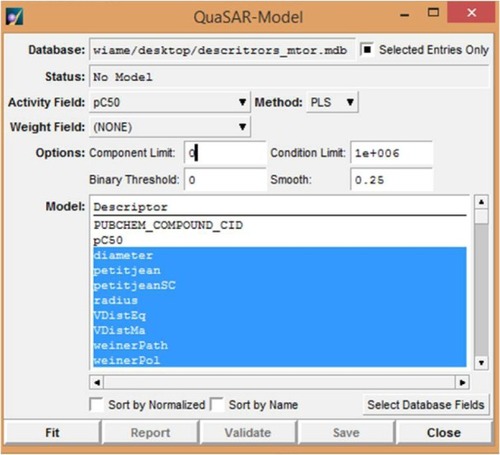
Figure 3 The QuaSAR fit validation panel.
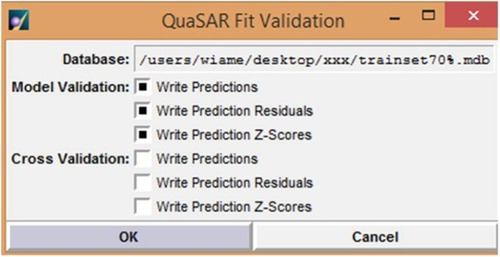
Figure 4 QuaSAR-Contingency report and descriptors selection in the training set.
Abbreviation: QSAR, quantitative structure–activity relationship.
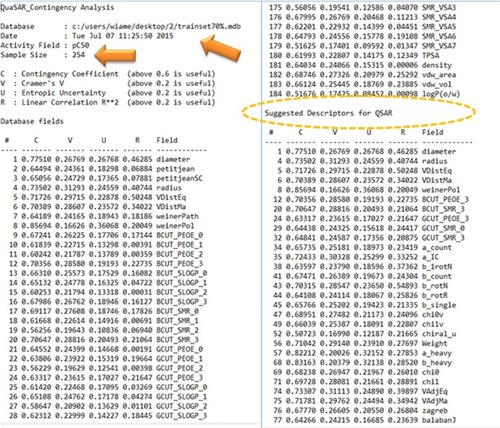
Figure 5 (A) Quantitative structure–activity relationship report using 66 selected descriptors. (B) Report of the cross-validation of the model generated by molecular operating environment.
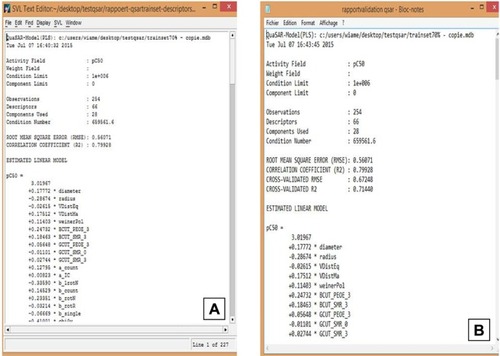
Figure 6 Relationship between observed and predicted data from QSAR model and the mammalian target of rapamycin inhibitors from two-dimensional QSAR (95% confidence interval).
Abbreviations: QSAR, quantitative structure–activity relationship; Pred, predicted.
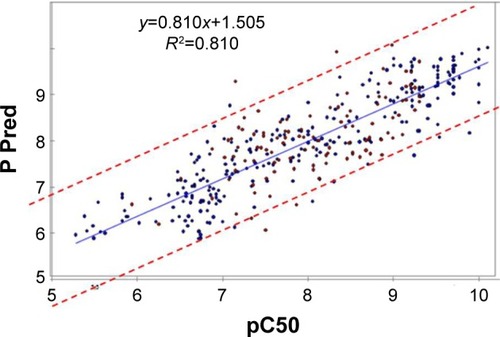
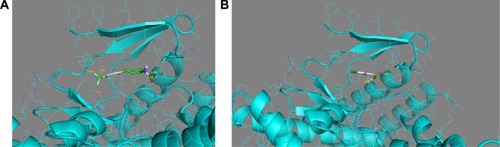
Figure 7 (A) Compound no 745 makes two hydrogen bonds with the hinge and connected to the helix. (B) Compound no 209 making an interaction with the internal pocket of the catalytic site of mTOR. Blue areas mean nitrogen atom, red areas mean oxygen atom, and green areas mean other. Numbers represent the size of the hydrogen bonds established between the ligand and the receptor. The bonds are represented by the dotted yellow line.