Figures & data
Scheme 1 A scheme of fluoroethyl bufalin and [18F]fluoroethyl bufalin synthesis.
![Scheme 1 A scheme of fluoroethyl bufalin and [18F]fluoroethyl bufalin synthesis.](/cms/asset/65c5f64e-c78c-451a-a588-412aed1f708b/dott_a_12195366_f0007_b.jpg)
Figure 1 HPLC chromatogram of [19F]fluoroethyl bufalin and [18F]fluoroethyl bufalin.
Abbreviations: DAD, diode array detector; HPLC, high-performance liquid chromatography; RCP, radiochemical purity; TR, retention time; UV, ultraviolet.
![Figure 1 HPLC chromatogram of [19F]fluoroethyl bufalin and [18F]fluoroethyl bufalin.](/cms/asset/d1de6500-351d-4d90-b09d-614dbd7bb70b/dott_a_12195366_f0001_c.jpg)
Figure 2 Stability of [18F]fluoroethyl bufalin at different intervals in 0.1 mol/L PBS (A) and mouse serum (B).
![Figure 2 Stability of [18F]fluoroethyl bufalin at different intervals in 0.1 mol/L PBS (A) and mouse serum (B).](/cms/asset/4c8c4788-68b9-4caf-a3c2-3c4637c6f446/dott_a_12195366_f0002_b.jpg)
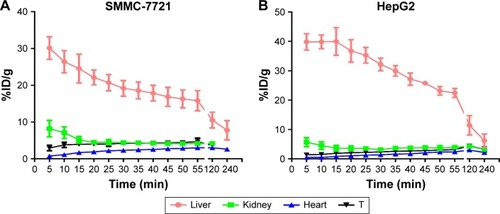
Figure 3 Biodistributions of [18F]fluoroethyl bufalin in SMMC-7721 (A) and HepG2 (B) xenograft-bearing nude mice.
Abbreviation: T, tumor.
![Figure 3 Biodistributions of [18F]fluoroethyl bufalin in SMMC-7721 (A) and HepG2 (B) xenograft-bearing nude mice.](/cms/asset/6b258609-908a-46c8-80f6-890d9c8e5e81/dott_a_12195366_f0003_c.jpg)
Table 1 Biodistribution of [18F]fluoroethyl bufalin in nude mice
Figure 4 The blood drug concentration–time curve for [18F]fluoroethyl bufalin in the ICR mice.
Abbreviations: ICR, Institute of Cancer Research; pi, post injection.
![Figure 4 The blood drug concentration–time curve for [18F]fluoroethyl bufalin in the ICR mice.](/cms/asset/56051b8b-3567-476d-bae1-12e41def3763/dott_a_12195366_f0004_b.jpg)
Table 2 Pharmacokinetic parameters of the [18F]fluoroethyl bufalin in ICR mice
Figure 5 Dynamic small-animal PET scans obtained for [18F]fluoroethyl bufalin with SMMC-7721 T-bearing mice and HepG2 T-bearing mice.
Abbreviations: PET, positron emission tomography; Ts, tumors.
![Figure 5 Dynamic small-animal PET scans obtained for [18F]fluoroethyl bufalin with SMMC-7721 T-bearing mice and HepG2 T-bearing mice.](/cms/asset/2aba7552-9535-4910-8212-e10b2c8a06af/dott_a_12195366_f0005_c.jpg)
Figure 6 Quantified time–activity curves of major organs in SMMC-7721 and HepG2 T-bearing mice.
Abbreviation: T, tumor.