Figures & data
Table 1 Clinicopathological characteristics of 120 OSCC patients
Figure 1 Representative images showing immunohistochemical staining for ZEB-1 and E-cadherin proteins in oral cavity squamous cell carcinoma (magnification ×200).
Abbreviations: ZEB-1, zinc-finger E-box binding homeobox 1; ITF, invasive tumor front.
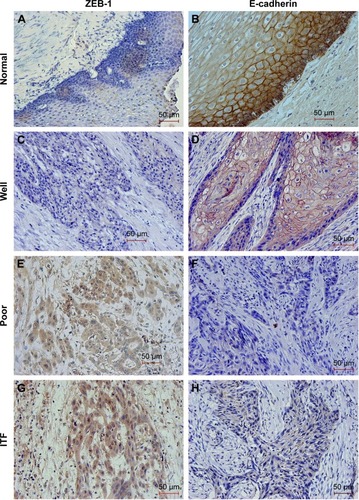
Figure 2 The relative expression levels of ZEB-1 and E-cadherin mRNA.
Abbreviations: ZEB-1, zinc-finger E-box binding homeobox 1; E-cad, E-cadherin; OSCC, oral cavity squamous cell carcinoma.
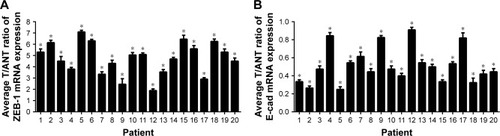
Table 2 Clinicopathologic correlation of ZEB-1 and E-cadherin expression in OSCC
Table 3 Univariate and multivariate analysis of factors affecting overall survival
Figure 3 Kaplan–Meier survival curve for overall survival according to each immunohistochemical staining group and different clinical factors.
Abbreviation: ZEB-1, zinc-finger E-box binding homeobox 1.
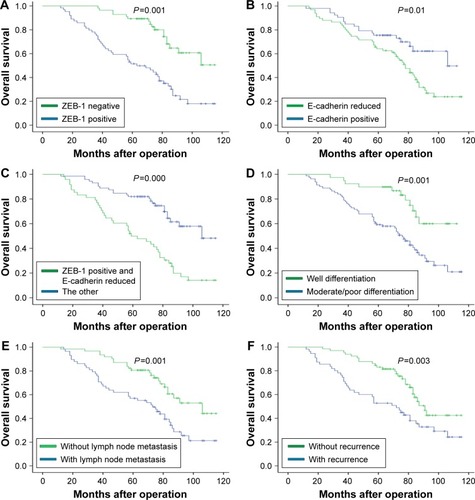
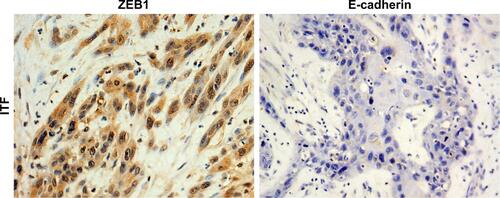
Figure S1 Representative images showing immunohistochemical staining for ZEB-1 and E-cadherin protein in the ITF of oral cavity squamous cell carcinoma (magnification ×200).
Abbreviation: ITF, invasive tumor front.